

Flow cytometric fluorescence pulse width analysis of etoposide-induced nuclear enlargement in HCT116 cells
- PMID: 20429026
- PMCID: PMC2903698
- DOI: 10.1007/s10529-010-0277-x
Flow cytometric fluorescence pulse width analysis of etoposide-induced nuclear enlargement in HCT116 cells
Abstract
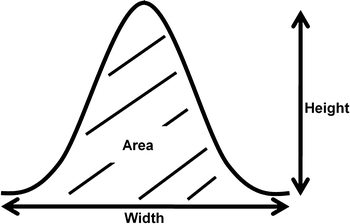
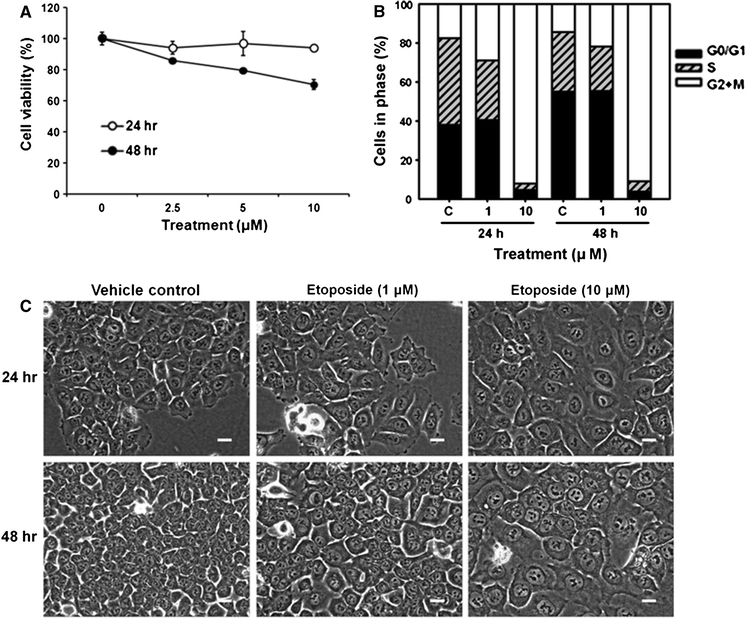
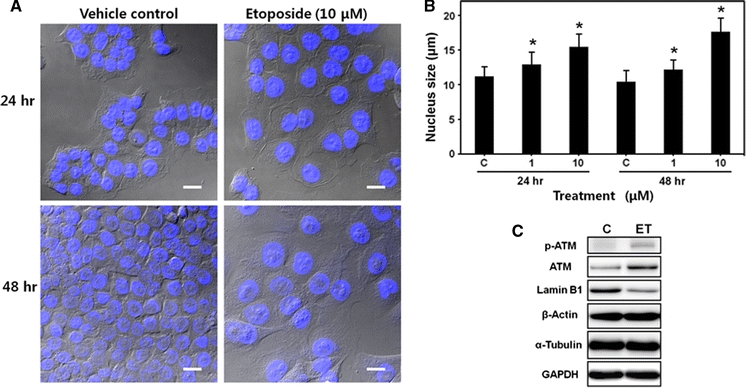
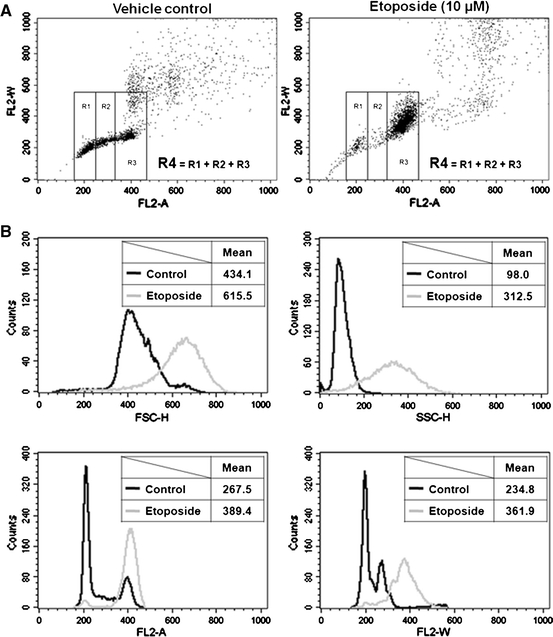
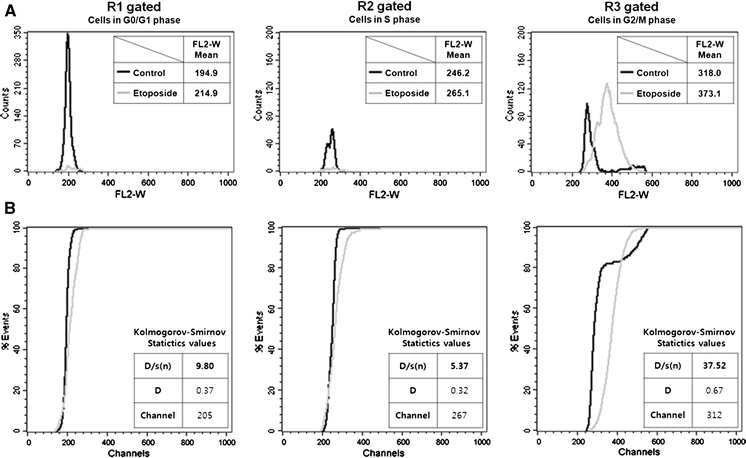
Fluorescence pulse width can provide size information on the fluorescence-emitting particle, such as the nuclei of propidium iodide-stained cells. To analyze nuclear size in the present study, rather than perform the simple doublet discrimination approach usually employed in flow cytometric DNA content analyses, we assessed the pulse width of the propidium iodide fluorescence signal. The anti-cancer drug etoposide is reportedly cytostatic, can induce a strong G2/M arrest, and results in nuclear enlargement. Based on these characteristics, we used etoposide-treated HCT116 cells as our experimental model system. The fluorescence pulse widths (FL2-W) of etoposide-treated (10 microM, 48 h) cells were distributed at higher positions than those of vehicle control, so the peak FL2-W value of etoposide-treated cells appeared at 400 while those of vehicle control cells appeared at 200 and 270. These results were consistent with our microscopic observations. This etoposide-induced increase in FL2-W was more apparent in G2/M phase than other cell cycle phases, suggesting that etoposide-induced nuclear enlargement preferentially occurred in G2/M phase cells rather than in G0/G1 or S phase cells.
Figures
Similar articles
-
Cell and nuclear enlargement of SW480 cells induced by a plant lignan, arctigenin: evaluation of cellular DNA content using fluorescence microscopy and flow cytometry.DNA Cell Biol. 2011 Aug;30(8):623-9. doi: 10.1089/dna.2010.1199. Epub 2011 Jun 11. DNA Cell Biol. 2011. PMID: 21663531
-
A new flow cytometric method for discrimination of apoptotic cells and detection of their cell cycle specificity through staining of F-actin and DNA.Cytometry. 1995 Jun 1;20(2):162-71. doi: 10.1002/cyto.990200209. Cytometry. 1995. PMID: 7545098
-
Drug-induced cell cycle modulation leading to cell-cycle arrest, nuclear mis-segregation, or endoreplication.BMC Cell Biol. 2011 Jan 13;12:2. doi: 10.1186/1471-2121-12-2. BMC Cell Biol. 2011. PMID: 21226962 Free PMC article.
-
Etoposide-induced cell cycle delay and arrest-dependent modulation of DNA topoisomerase II in small-cell lung cancer cells.Br J Cancer. 1994 Nov;70(5):914-21. doi: 10.1038/bjc.1994.420. Br J Cancer. 1994. PMID: 7947097 Free PMC article.
-
[Cytotoxic mechanism and antineoplastic action of etoposide].Postepy Hig Med Dosw. 1998;52(1):67-87. Postepy Hig Med Dosw. 1998. PMID: 9608232 Review. Polish.
Cited by
-
Bleomycin Inhibits Proliferation via Schlafen-Mediated Cell Cycle Arrest in Mouse Alveolar Epithelial Cells.Tuberc Respir Dis (Seoul). 2019 Apr;82(2):133-142. doi: 10.4046/trd.2017.0124. Epub 2018 Jun 19. Tuberc Respir Dis (Seoul). 2019. PMID: 29926548 Free PMC article.
-
Giant Unilamellar Vesicle Electroformation: What to Use, What to Avoid, and How to Quantify the Results.Membranes (Basel). 2021 Nov 7;11(11):860. doi: 10.3390/membranes11110860. Membranes (Basel). 2021. PMID: 34832088 Free PMC article. Review.
-
A novel topoisomerase inhibitor, daurinol, suppresses growth of HCT116 cells with low hematological toxicity compared to etoposide.Neoplasia. 2011 Nov;13(11):1043-57. doi: 10.1593/neo.11972. Neoplasia. 2011. PMID: 22131880 Free PMC article.
-
A Flow Cytometric Method to Quantify the Endosomal Escape of a Protein Toxin to the Cytosol of Target Cells.Pharm Res. 2019 Dec 23;37(1):16. doi: 10.1007/s11095-019-2725-1. Pharm Res. 2019. PMID: 31873810 Free PMC article.
-
High Throughput Analysis of Golgi Structure by Imaging Flow Cytometry.Sci Rep. 2017 Apr 11;7(1):788. doi: 10.1038/s41598-017-00909-y. Sci Rep. 2017. PMID: 28400563 Free PMC article.
References
-
- Hoffman RA (2009) Pulse width for particle sizing. Curr Protoc Cytom Chapter 1:Unit 1.23 - PubMed
Publication types
MeSH terms
Substances
LinkOut - more resources
Full Text Sources
