. 2010 Apr 30:10:118.
doi: 10.1186/1471-2148-10-118.

Nuclear gene phylogeography using PHASE: dealing with unresolved genotypes, lost alleles, and systematic bias in parameter estimation

Affiliations

Nuclear gene phylogeography using PHASE: dealing with unresolved genotypes, lost alleles, and systematic bias in parameter estimation

Ryan C Garrick et al. BMC Evol Biol. .

Abstract

Background: A widely-used approach for screening nuclear DNA markers is to obtain sequence data and use bioinformatic algorithms to estimate which two alleles are present in heterozygous individuals. It is common practice to omit unresolved genotypes from downstream analyses, but the implications of this have not been investigated. We evaluated the haplotype reconstruction method implemented by PHASE in the context of phylogeographic applications. Empirical sequence datasets from five non-coding nuclear loci with gametic phase ascribed by molecular approaches were coupled with simulated datasets to investigate three key issues: (1) haplotype reconstruction error rates and the nature of inference errors, (2) dataset features and genotypic configurations that drive haplotype reconstruction uncertainty, and (3) impacts of omitting unresolved genotypes on levels of observed phylogenetic diversity and the accuracy of downstream phylogeographic analyses.

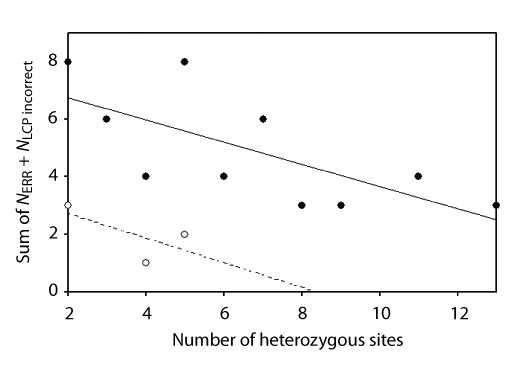
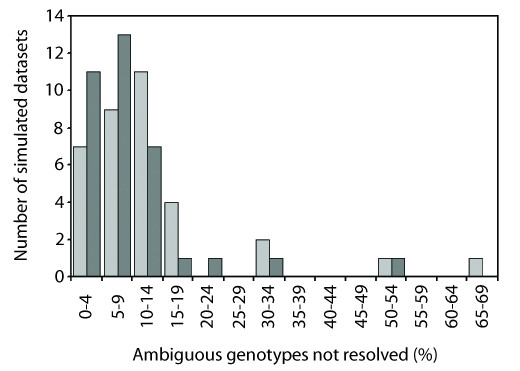
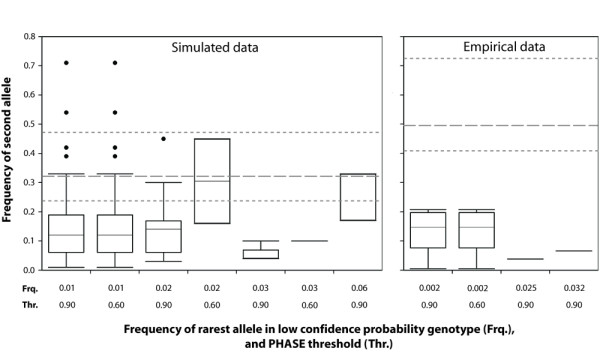
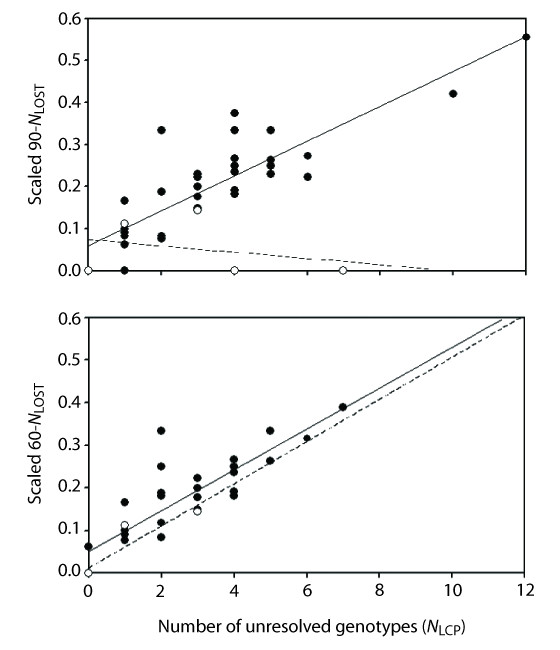
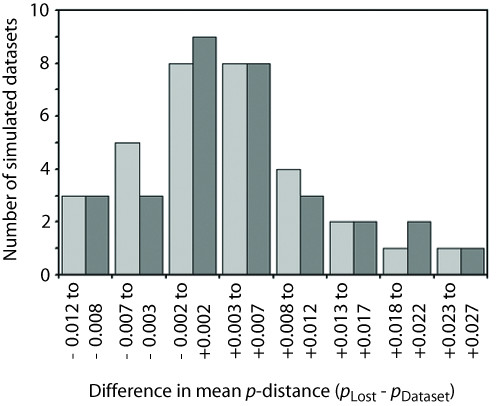
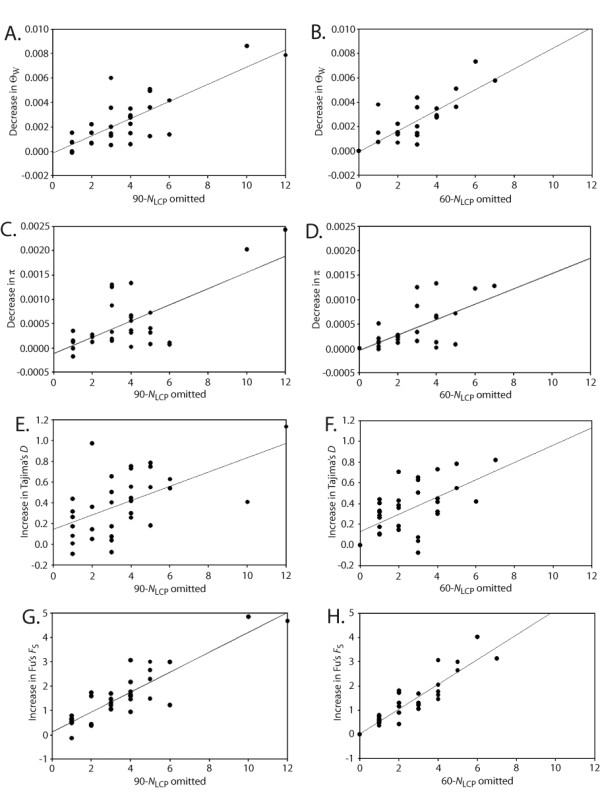
Results: We found that PHASE usually had very low false-positives (i.e., a low rate of confidently inferring haplotype pairs that were incorrect). The majority of genotypes that could not be resolved with high confidence included an allele occurring only once in a dataset, and genotypic configurations involving two low-frequency alleles were disproportionately represented in the pool of unresolved genotypes. The standard practice of omitting unresolved genotypes from downstream analyses can lead to considerable reductions in overall phylogenetic diversity that is skewed towards the loss of alleles with larger-than-average pairwise sequence divergences, and in turn, this causes systematic bias in estimates of important population genetic parameters.

Conclusions: A combination of experimental and computational approaches for resolving phase of segregating sites in phylogeographic applications is essential. We outline practical approaches to mitigating potential impacts of computational haplotype reconstruction on phylogeographic inferences. With targeted application of laboratory procedures that enable unambiguous phase determination via physical isolation of alleles from diploid PCR products, relatively little investment of time and effort is needed to overcome the observed biases.


Figures

Figure 1
Figure 1
Relationship between the number of heterozygous sites in an ambiguous genotype (x-axis) and haplotype pair reconstruction error (y-axis). Simulated datasets (solid circles) and empirical datasets (open circles) both showed strong negative correlations (r = -0.692 and r = -0.655, respectively). The plot is identical for the 0.90 and 0.60 PHASE confidence probability thresholds (the latter not shown).
Figure 2
Figure 2
Frequency distribution of the number of unresolved genotypes (NLCP) represented as a proportion of the total number of ambiguous genotypes present in each simulated dataset. Distributions for PHASE confidence probability thresholds 0.90 and 0.60 are shown in pale grey and dark grey, respectively.
Figure 3
Figure 3
Genotypic configurations of unresolved genotypes in simulated and empirical datasets. Population allele frequency values for the more common allele in an unresolved genotype are shown on a continuous scale (y-axis), with a separate box plot drawn for each observed value of the rarer allele in an unresolved genotype (x-axis). In each plot, the box represents the inner 50% quantile (median marked by a solid black line), and the whiskers represent the upper and lower 25% quantile, excluding outliers (solid black circles). For comparative purposes, the population frequency of the most common allele present in each dataset was used to calculate an overall median and inner 50% quantile (dashed grey lines) for simulated and empirical datasets.
Figure 4
Figure 4
Relationship between the number of unresolved genotypes (x-axis) and reduction in the total number of gene lineages (y-axis). Top: simulated datasets (solid circles) and empirical datasets (open circles) examined under a PHASE confidence probability threshold of 0.90. Bottom: simulated and empirical datasets examined under the 0.60 threshold. Except for the empirical data under the 0.90 threshold, all regressions were significantly positive (P < 0.0001).
Figure 5
Figure 5
Frequency distribution of the difference in mean p-distance for only those pair-wise comparisons involving lost alleles (pLOST) and mean from all alleles within a dataset (pDATASET). Distributions for PHASE confidence probability thresholds 0.90 and 0.60 are shown in pale grey and dark grey, respectively.
Figure 6
Figure 6
Relationship between the number of unresolved genotypes omitted from a dataset (x-axis) and under- or over-estimation of population genetic parameters commonly used in phylogeographic analyses (y-axis). A-B, decrease in theta (ΘW) under the 0.90 and 0.60 thresholds; C-D, decrease in nucleotide diversity (π) under the 0.90 and 0.60 thresholds; E-F, increase in Tajima's D under the 0.90 and 0.60 thresholds; G-H, increase in Fu's FS under the 0.90 and 0.60 thresholds.
Figure 7
Figure 7
Statistical parsimony networks constructed for simulated dataset 'Sim21' using TCS [49]with the 95% confidence criterion enforced. A: full dataset (i.e., 100 sequences from 50 diploid genotypes). B: pruned dataset with five unresolved genotypes omitted. Ovals are distinct haplotypes and are drawn proportional to haplotype frequency. Each single line represents one mutational step, and small circles dividing single lines are inferred haplotypes that were not present in the dataset. A rectangle indicates the haplotype with the highest outgroup probability in each network. In this particular case, both the 0.90 and 0.60 PHASE thresholds produced identical outcomes.

Similar articles

Cited by

References

    1. Brito P, Edwards SV. Multilocus phylogeography and phylogenetics using sequence-based markers. Genetica. 2009;135:439–455. doi: 10.1007/s10709-008-9293-3. - DOI - PubMed
    1. Friesen VL, Congdon BC, Kidd MG, Birt TP. Polymerase chain reaction primers for the amplification of five nuclear introns in vertebrates. Mol Ecol. 1999;8:2147–2149. doi: 10.1046/j.1365-294x.1999.00802-4.x. - DOI - PubMed
    1. Jarman SN, Ward RD, Elliot NG. Oligonucleotide primers for PCR amplification of coelomate introns. Mar Biotechnol. 2002;4:347–355. doi: 10.1007/s10126-002-0029-6. - DOI - PubMed
    1. Carstens BC, Knowles LL. Shifting distributions and speciation: species divergence during rapid climate change. Mol Ecol. 2007;16:619–627. doi: 10.1111/j.1365-294X.2006.03167.x. - DOI - PubMed
    1. Garrick RC, Rowell DM, Simmons CS, Hillis DM, Sunnucks P. Fine-scale phylogeographic congruence despite demographic incongruence in two low-mobility saproxylic springtails. Evolution. 2008;62:1103–1118. doi: 10.1111/j.1558-5646.2008.00349.x. - DOI - PubMed

Publication types

LinkOut - more resources