. 2010 Sep 1;268(1-2):22-37.
doi: 10.1016/j.heares.2010.04.007. Epub 2010 Apr 27.

Overshoot measured physiologically and psychophysically in the same human ears

Affiliations

Overshoot measured physiologically and psychophysically in the same human ears

Kyle P Walsh et al. Hear Res. .

Erratum in

  • Hear Res. 2011 Oct;280(1-2):246

Abstract

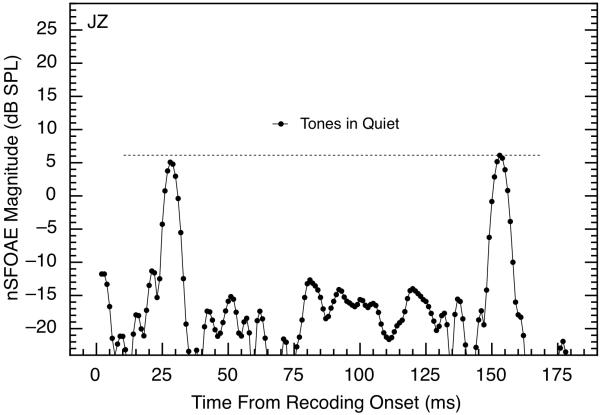
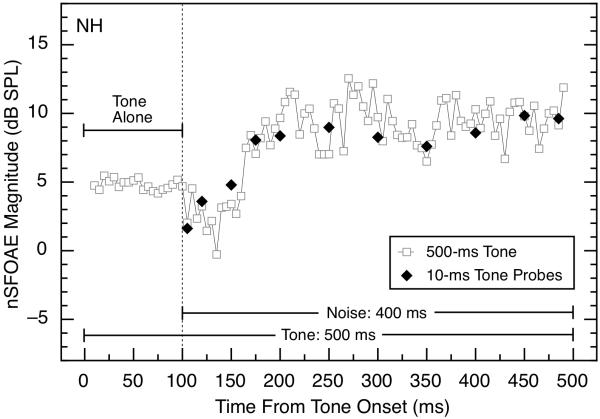
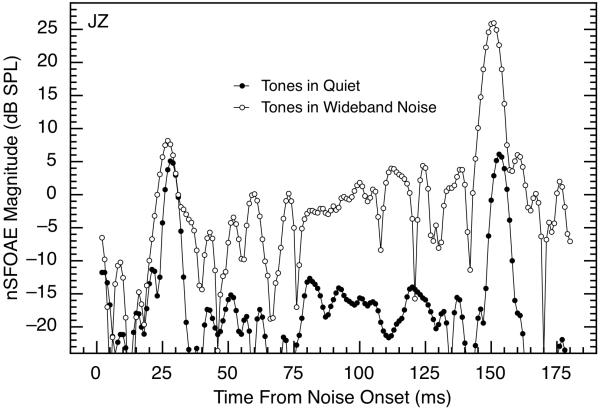
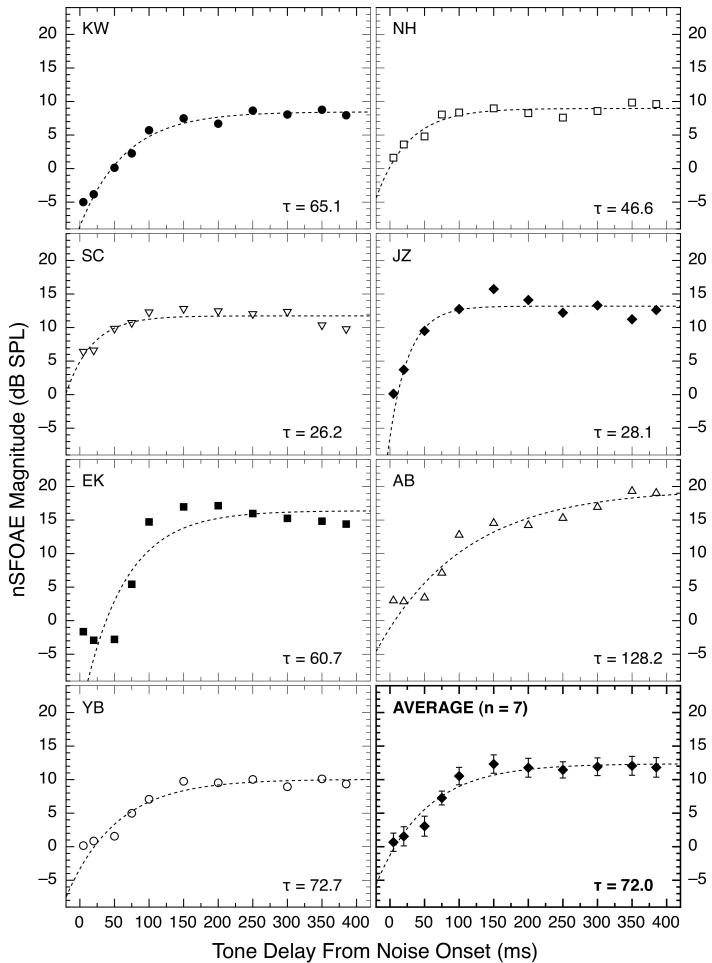
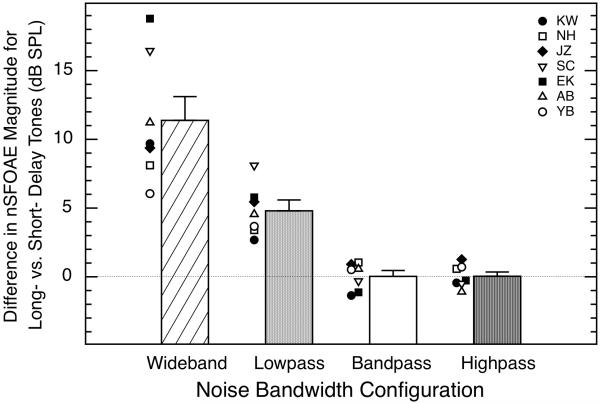
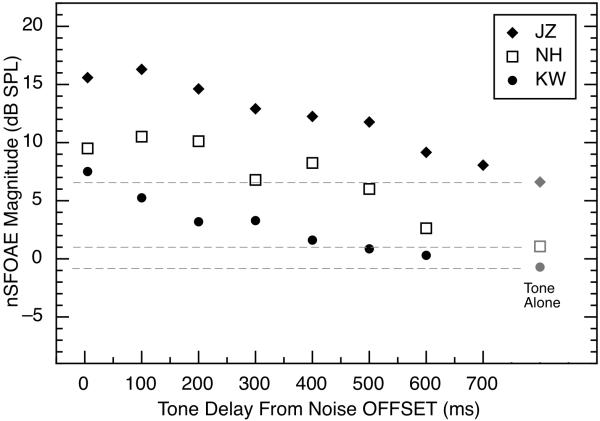
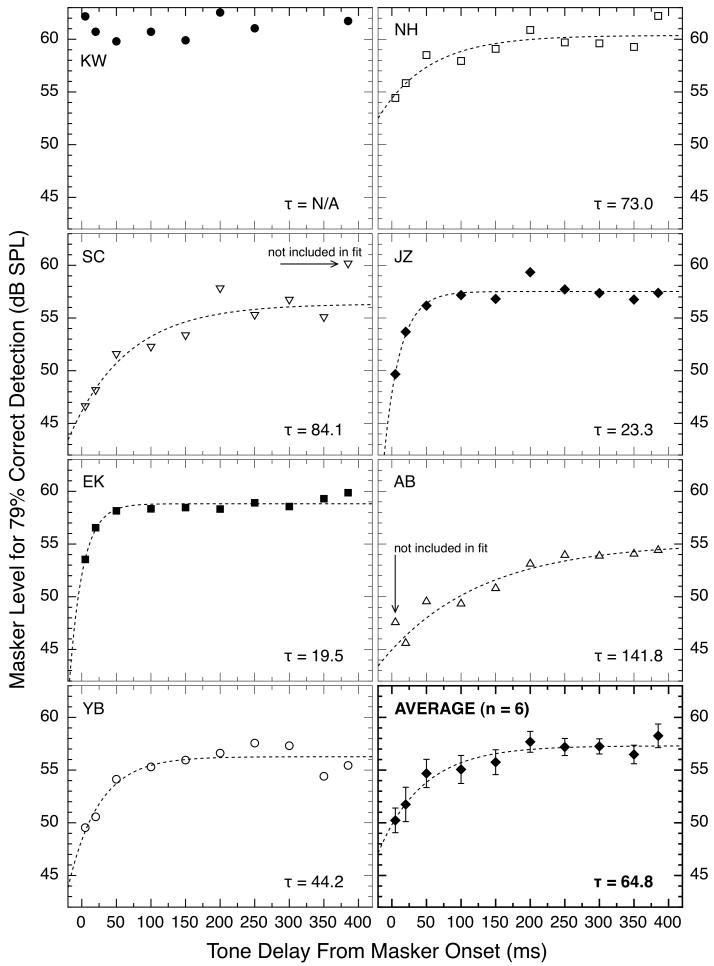
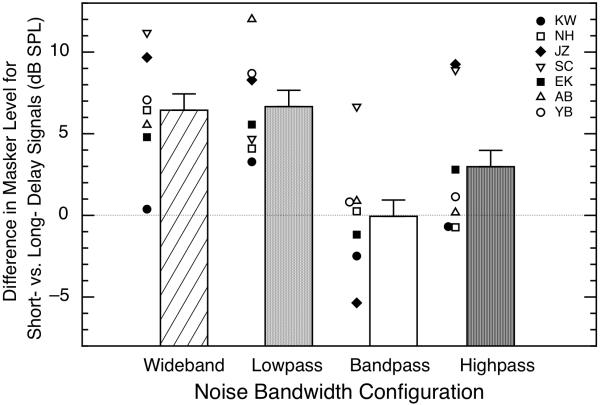
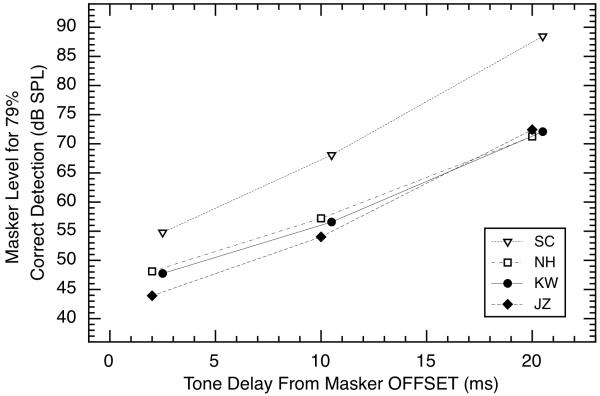
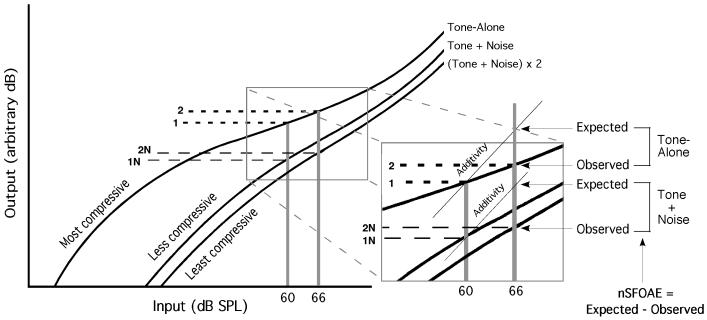
A nonlinear version of the stimulus-frequency otoacoustic emission (SFOAE) was measured using stimulus waveforms similar to those used for behavioral overshoot. Behaviorally, the seven listeners were as much as 11 dB worse at detecting a brief tonal signal (4.0 kHz, 10 ms in duration) when it occurred soon after the onset of a wideband masking noise (0.1-6.0 kHz; 400 ms in duration) than when it was delayed by about 200 ms, and the nonlinear SFOAE measure exhibited a similar effect. When either lowpass (0.1-3.8 kHz) or bandpass noise (3.8-4.2 kHz) was used instead of the wideband noise, the physiological and behavioral measures again were similar. When a highpass noise (4.2-6.0 kHz) was used, the physiological and behavioral measures both showed no overshoot-like effect for five of the subjects. The physiological response to the tone decayed slowly after the termination of the noise, much like the time course of resetting for behavioral overshoot. One subject exhibited no overshoot behaviorally even though his cochlear responses were like those of the other subjects. Overall, the evidence suggests that some basic characteristics of overshoot are obligatory consequences of cochlear function, as modulated by the olivocochlear efferent system.


Figures

Fig. 1
Fig. 1
Magnitudes of nSFOAE responses to two brief 4.0-kHz tones of 60 dB SPL each and presented in the quiet. Onsets of the tones were at 25 and 150 ms from the onset of the recording period, and tone durations were 10 ms each (5 ms rise, 5 ms decay, with no steady-state segment). The dashed horizontal line reveals that the maximum magnitudes of the two nSFOAE responses were essentially identical. Data are based on 50 triplets obtained from subject JZ; the same outcome was obtained from other subjects.
Fig 2
Fig 2
Comparison of the magnitudes of nSFOAE responses to a long-duration (500-ms) tone or short-duration (10-ms) tone bursts presented with differing time delays following onset of the wideband noise. The tone was 4.0 kHz at 60 dB SPL, and the noise was 0.1 – 6.0 kHz wide, 25 dB spectrum level, and 400 ms in duration. Results are shown only for subject NH, but they are representative. For the 500-ms tone, points are plotted for 5-ms steps of the analysis window. Some of the fluctuations in the nSFOAE response to the long-duration tone are attributable to the envelope fluctuations in the specific noise sample used (see Walsh et al., 2010, Figs. 2 and 3).
Fig. 3
Fig. 3
Magnitudes of nSFOAE responses to two brief tones presented in the quiet (solid symbols) or with a wideband noise (open symbols). Data for the tones in the quiet are replotted from Fig. 1. Results are shown for subject JZ, but they are representative. For purposes of this illustration only, the two tone bursts were separated by a time interval considerably shorter than the minimum used during actual data collection (which was 195 ms), and the remaining 200 ms of noise-alone following the second tone were omitted for clarity. The two sets of data shown here were obtained in the same test session.
Fig. 4
Fig. 4
Gradually increasing magnitudes of the nSFOAE response to brief tones presented at differing times following the onset of the 400-ms wideband noise. For efficiency, these data were collected in blocks of trials in which every stimulus presentation contained two tone delays, always separated by at least 195 ms. The tone was 4.0 kHz, 60 dB SPL in level, and 10 ms in duration, and the noise was 0.1 – 6.0 kHz wide, 25 dB spectrum level, and 400 ms in duration. Each subject’s data are shown in a separate panel; the four subjects at the top were the first crew of listeners tested. The dashed lines show the best-fitting positive exponential functions beginning 20 ms after noise onset (the hesitation). The weaker nSFOAE response for short delays than for long delays is reminiscent of the behavioral phenomenon of overshoot.
Fig. 5
Fig. 5
Differences in nSFOAE magnitudes for long-delay (200-ms) and short-delay (5-ms) tones plotted as a function of noise bandwidth. Bars indicate averages across all seven subjects, and symbols indicate individual data in each condition. The noise bandwidths were: 0.1 – 6.0 kHz (wideband), 0.1 – 3.8 kHz (lowpass), 3.8 – 4.2 kHz (bandpass), and 4.2 – 6.0 kHz (highpass); for all bandwidths, the spectrum level of the noise was 25 dB. Error bars indicate one standard error of the mean difference. For the highpass and bandpass noises, there was no rising, dynamic response to noise onset, and the responses to the short- and long-delay tones were essentially the same.
Fig. 6
Fig. 6
Magnitude of the nSFOAE response to brief tones presented at various time delays after the offset of a 200-ms wideband noise (25 dB spectrum level). Tones were 4.0 kHz, 60 dB SPL in level, and 10 ms in duration. The grey symbols at the right and the dashed horizontal lines show the magnitude of each subject’s nSFOAE response to the 60-dB tone presented alone. Recovery to tone-alone levels was much slower than the rise to maximum magnitude shown in Fig. 4. For efficiency, these data were collected in blocks of trials in which every stimulus presentation contained two tone delays, always separated by at least 200 ms. The values plotted are the maximum magnitudes of the nSFOAE response to each tone presentation.
Fig. 7
Fig. 7
Masker levels required for 79% correct detections of a brief tonal signal are plotted as a function of signal delay from onset of the 400-ms masking noise. The signal was 4.0 kHz and 10 ms in duration; the noise was 0.1 – 6.0 kHz, 25 dB spectrum level, and 400 ms in duration. Each subject’s data are shown in a separate panel. The dashed lines show the best-fitting positive exponential functions. For subject SC, the final data point was excluded when fitting the exponential function, and for subject AB the first data point was excluded from the fit (the fits were poor when these data were included).
Fig. 8
Fig. 8
Differences in masker level necessary for a fixed level of detectability (79% correct) between short-delay (5-ms) and long-delay (200-ms) signals, using maskers of differing bandwidth. The signal was 4.0 kHz, 60 dB SPL, and 10 ms in duration. Bars indicate averages across all seven subjects and symbols indicate individual data in each condition. The noise bandwidths were: 0.1 – 6.0 kHz (wideband), 0.1 – 3.8 kHz (lowpass), 3.8 – 4.2 kHz (bandpass), and 4.2 – 6.0 kHz (highpass). Error bars indicate one standard error of the mean difference. For each bandwidth of the noise, at least 3 blocks of 50 trials each were collected for both the short- and long-delay conditions for every subject.
Fig. 9
Fig. 9
Masker levels required for 79% correct detections of a brief tonal signal presented at three temporal delays (2, 10, and 20 ms) after the offset of a wideband masker. The tone was 4.0 kHz, 45 dB SPL in level, and 10 ms in duration; the noise was wideband (0.1 – 6.0 kHz), 200 ms in duration, and varied adaptively in level. Some symbols have been laterally displaced slightly for clarity.
Fig. 10
Fig. 10
Diagram illustrating the input/output functions presumed to be relevant during stimulus conditions of the sort used here. When only tone-alone was presented, the same input/output function (designated Tone-Alone) was relevant for both the single-earphone and two-earphone presentations of each triplet; only the operating point on that function varied. When tone-plus-noise was presented, the cochlear gain was reduced and different input/output functions became relevant. The expanded insert shows the differences between Observed and Expected responses (which is the nSFOAE) for particular tone-alone and tone-plus-noise conditions.

Similar articles

Cited by

References

    1. Bacon SP. Effect of masker level on overshoot. J. Acoust. Soc. Am. 1990;88:698–702. - PubMed
    1. Bacon SP, Liu L. Effects of ipsilateral and contralateral precursors on overshoot. J. Acoust. Soc. Am. 2000;108:1811–1818. - PubMed
    1. Bacon SP, Takahashi GA. Overshoot in normal-hearing and hearing-impaired subjects. J. Acoust. Soc. Am. 1992;91:2865–2871. - PubMed
    1. Bacon SP, Repovsch-Duffey JL, Liu L. Effects of signal delay on auditory filter shapes derived from psychophysical tuning curves and notched-noise data obtained in simultaneous masking. J. Acoust. Soc. Am. 2002;112:227–237. - PubMed
    1. Backus BC, Guinan JJ., Jr. Time-course of the human medial olivocochlear reflex. J. Acoust. Soc. Am. 2006;119:2889–2904. - PubMed

Publication types