Review
. 2011 Jan;271(1-2):115-22.
doi: 10.1016/j.heares.2010.03.084. Epub 2010 Apr 27.

Spatial and temporal processing of single auditory cortical neurons and populations of neurons in the macaque monkey

Affiliations
Review

Spatial and temporal processing of single auditory cortical neurons and populations of neurons in the macaque monkey

Gregg H Recanzone et al. Hear Res. 2011 Jan.

Abstract

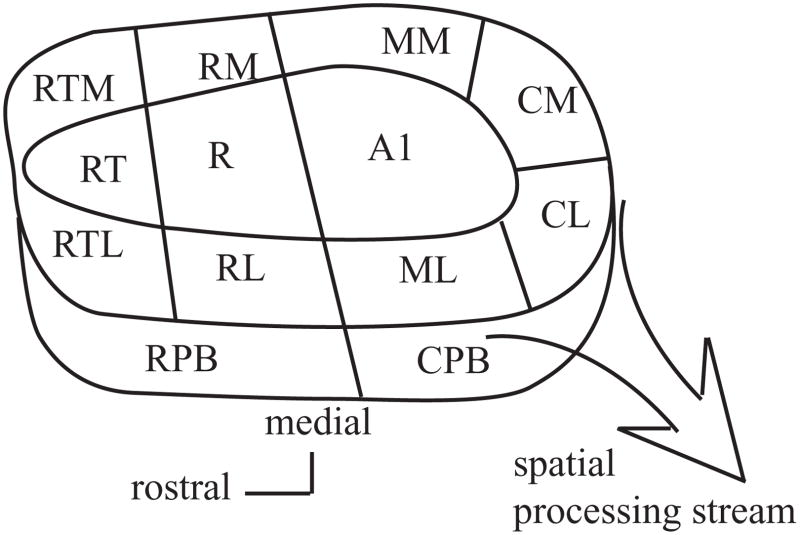
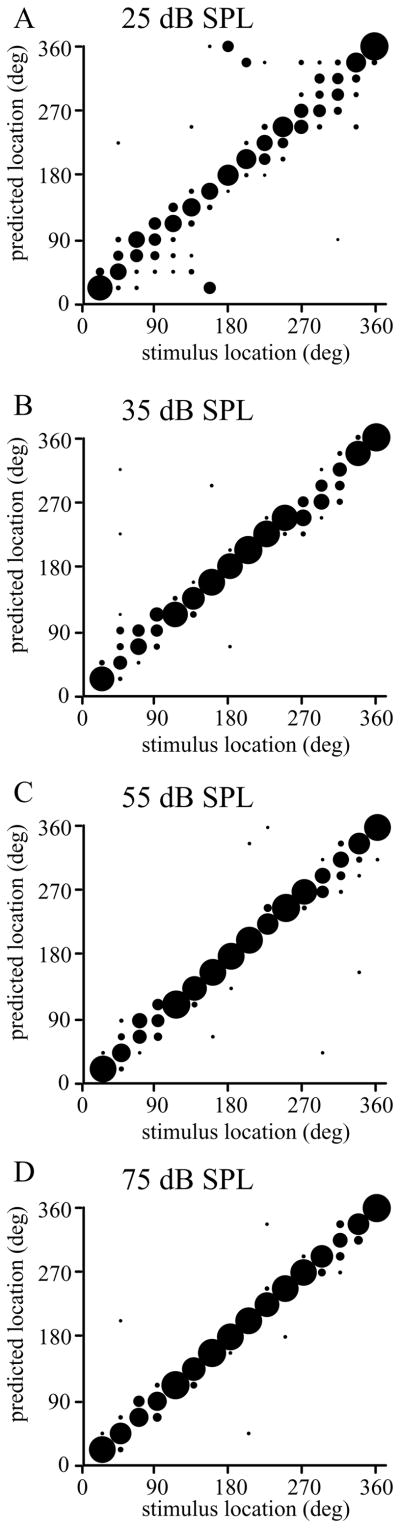
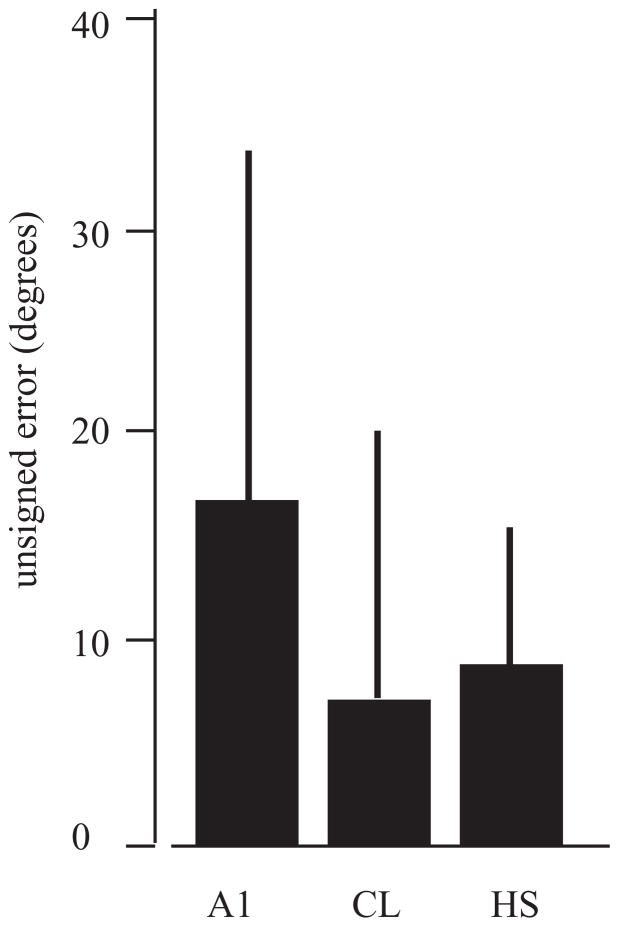
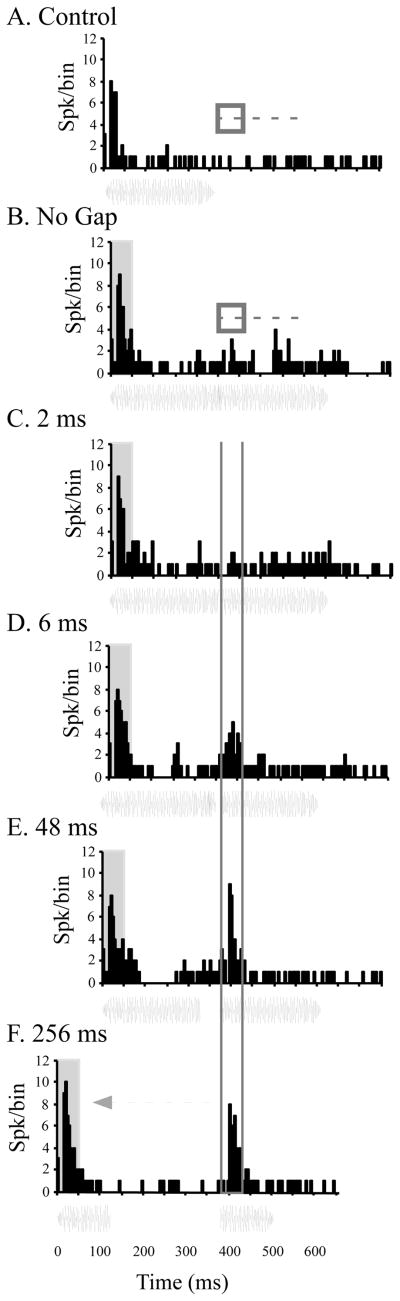
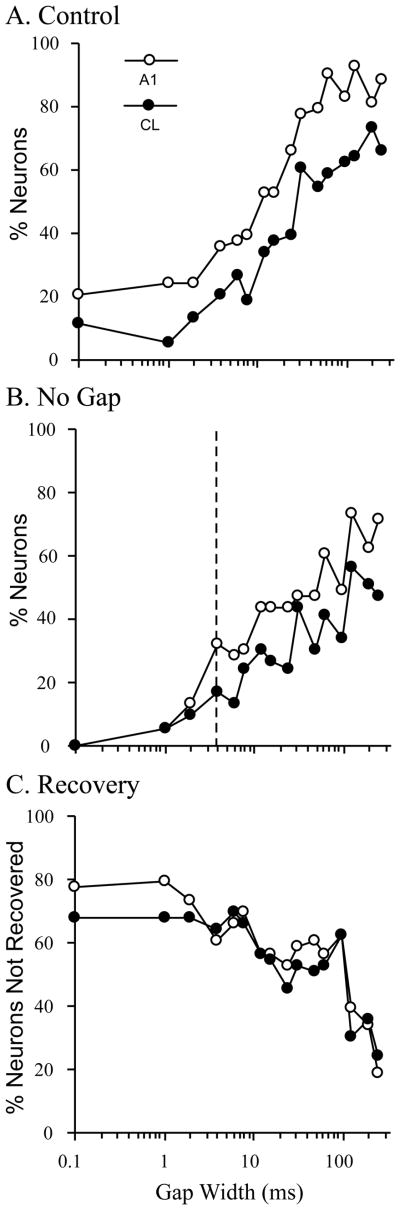
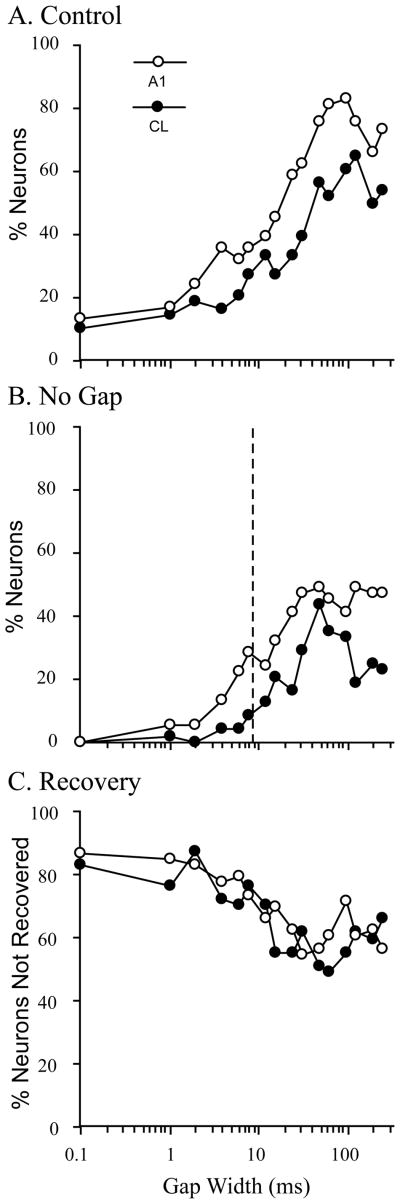
The auditory cortex is known to be a necessary neural structure for the perception of acoustic signals, particularly the spatial location and the temporal features of complex auditory stimuli. Previous studies have indicated that there is no topographic map of acoustic space in the auditory cortex and it has been proposed that spatial locations are represented by some sort of population code. Additionally, in spite of temporal processing deficits being one of the hallmark consequences of normal aging, the temporal coding of acoustic stimuli remains poorly understood. This report will address these two issues by discussing the results from several studies describing responses of single auditory cortical neurons in the non-human primate. First, we will review studies that have addressed potential spike-rate population codes of acoustic space in the caudal belt of auditory cortex. Second, we will present new data on the neuronal responses to gap stimuli in aged monkeys and compare them to published reports of gap detection thresholds. Together these studies indicate that the alert macaque monkey is an excellent model system to study both spatial and temporal processing in the auditory cortex at the single neuron level.


Figures

Figure 1
Figure 1
Schematic diagram of the primate auditory cortex. The auditory cortex is made up of multiple cortical fields organized into a core-belt-parabelt fashion. The caudal fields are believed to form a spatial processing stream. Adapted from Kaas and Hackett, 2000; Hackett et al., 2001. Core; A1: primary auditory cortex, R: rostral field, RT: rostrotemporal field. Belt; CM: caudomedial field, CL: caudolateral field, ML: middle lateral field, RL: rostrolateral field, RTL: rostrotemporal lateral field, RTM: rostrolateral lateral field, RM: rostromedial field, MM: middle medial field. Parabelt; RPB: rostral parabelt, CPB: caudal parabelt.
Figure 2
Figure 2
Example responses of a single neuron to broadband noise stimuli from different locations in frontal space. Each PSTH is for a stimulus located directly ahead (center), or along one of two concentric rings at 15 or 30 degrees eccentricity. Numbers along the outer circle of PSTHs denote the location in degrees of azimuth and elevation. Stimuli were 200 ms of ‘unfrozen’ noise. The firing rate of this cell was greater toward the contralateral (right) side of acoustic space. Adapted from Recanzone et al., 2000b.
Figure 3
Figure 3
Population coding of acoustic space. Each bar of the histogram shows the ratio of the neural/behavioral spatial discrimination threshold based on the firing rates of neurons that were significantly tuned. Threshold ratios were based on the distribution of firing rates as a function of spatial location in azimuth and elevation for the broadband noise, three one-octave band-passed noise and six tones tested both electrophysiologically and behaviorally. Neurons in the caudal belt, labeled CM but likely included many CL neurons as well, were more accurate than A1 neurons, and their estimates were not significantly different from a ratio of 1.0 (no difference). Adapted from Recanzone et al., 2000b.
Figure 4
Figure 4
Example of a neural response across 360 degrees of space. Each raster shows the response to a 200 msec broadband noise presented from one of 16 locations. Recordings were made in the left auditory cortex. Responses were greater for locations in the right hemifield (contralateral) compared to the left hemifield. Data taken from Woods et al., 2006.
Figure 5
Figure 5
Localization of broadband noise in human subjects. Each plot shows the response of a single subject to each of 16 locations using the same stimuli as used in the monkey physiology experiments. The actual target location is on the x-axis, and the estimates by the subject are on the y-axis, thus, errors are shown vertically. The size of the circle is proportional to the percentage of responses at each location on the y-axis. This subject showed the most errors at the lowest intensity stimulus (25 dB, panel A), particularly toward the rear hemifield. The performance improved with increasing stimulus intensity (panels B – D). Adapted from Miller and Recanzone, 2009.
Figure 6
Figure 6
Mean unsigned errors for model estimates based on neuronal data taken from A1 and CL and compared to the mean unsigned errors measured in human subjects (HS). Model estimates based on the firing rates of CL neurons was not different from that of the human subjects, although estimates based on A1 neurons were worse. Adapted from Miller and Recanzone, 2009.
Figure 7
Figure 7
Representative example of a single neuron responding to the noise stimuli. Panel A shows the response to the control stimulus, which is just the pre-gap stimulus. Panel B shows the response to the full duration no-gap stimulus. Panels C – F show the response to stimuli with increasing gap sizes. Comparisons were made between the response to the 50 msec post-gap stimulus (vertical lines in panels C-F) and (i) the same period following the offset of the control stimulus. This varied with the gap duration that was being tested, and is represented by the box and dashed horizontal line in panel A. The post-gap stimulus response was also compared to (ii) the same period during the no-gap stimulus. This also varied with the gap duration that was being tested and is represented by the box and dashed line in panel B. Finally this post-gap stimulus response was compared to (iii) the onset of the gap stimulus, represented by the shaded region at the start of the PSTH in panels B-F. This neuron had no clear gap-response until 6 msec, but did not fully recover even with a gap size of 256 msec. PSTHs are offset in order to align the gap-response between panels B – F.
Figure 8
Figure 8
Discriminability of the post-gap response. A. Percent neurons that the ROC analysis could reliably discriminate the difference between the gap stimulus and the control stimulus (ROC > 0.75). A1 neurons were much better at making this discrimination than CL neurons, where the ideal observer was able to make this discrimination on only about 60% of CL neurons. B. Analysis comparing the post-gap response to the no-gap response. Again, A1 neurons were better able to make this discrimination than CL neurons. The dashed vertical line shows the psychophysical threshold taken from a different set of monkeys (Petkov et al., 2003). C. Analysis comparing the response to the post-gap stimulus to the response to the stimulus onset. The y-axis shows the percent of neurons that were not fully recovered based on an ROC values between 0.25 and 0.75 (no difference between the gap response and the control response). A1 and CL neurons were equivalent in this recovery. Even at 256 msec gap durations, about 20% of neurons were not yet fully recovered (see Fig. 7).
Figure 9
Figure 9
Discriminability of the post-gap response to tone-in-noise stimuli. The same analysis as shown in Figure 8 for noise stimuli is shown here for gaps in a 65 dB SPL tone stimulus at the CF of the neuron under study, embedded in a background of 45 dB SPL broadband noise stimuli. The basic features of these neuronal responses are similar to those for noise stimuli. Conventions as in Figure 8.

Similar articles

Cited by

References

    1. Altshuler MW, Comalli PE. Effect of stimulus intensity and frequency on median horizontal plane sound localization. J Auditory Res. 1975;15:262–265.
    1. Beitel RE, Kaas JH. Effects of bilateral and unilateral ablation of auditory cortex in cats on the unconditioned head orienting response to acoustic stimuli. J Neurophysiol. 1993;70:351–369. - PubMed
    1. Bendor D, Wang X. Neural response properties of primary, rostral, and rostrotemporal core fields in the auditory cortex of marmoset monkeys. J Neurophysiol. 2008;100:888–906. - PMC - PubMed
    1. Bennett CL, Davis RT, Miller JM. Demonstration of presbycusis across repeated measures in a nonhuman primate species. Behav Neurosci. 1983;97:602–607. - PubMed
    1. Blauert J. The Psychophysics of Human Sound Localization. 2. MIT Press; 1997. Spatial Hearing.

Publication types