. 2010 Aug 15;52(2):455-69.
doi: 10.1016/j.neuroimage.2010.04.236. Epub 2010 Apr 27.

Genetic influences on brain asymmetry: a DTI study of 374 twins and siblings

Affiliations

Genetic influences on brain asymmetry: a DTI study of 374 twins and siblings

Neda Jahanshad et al. Neuroimage. .

Abstract

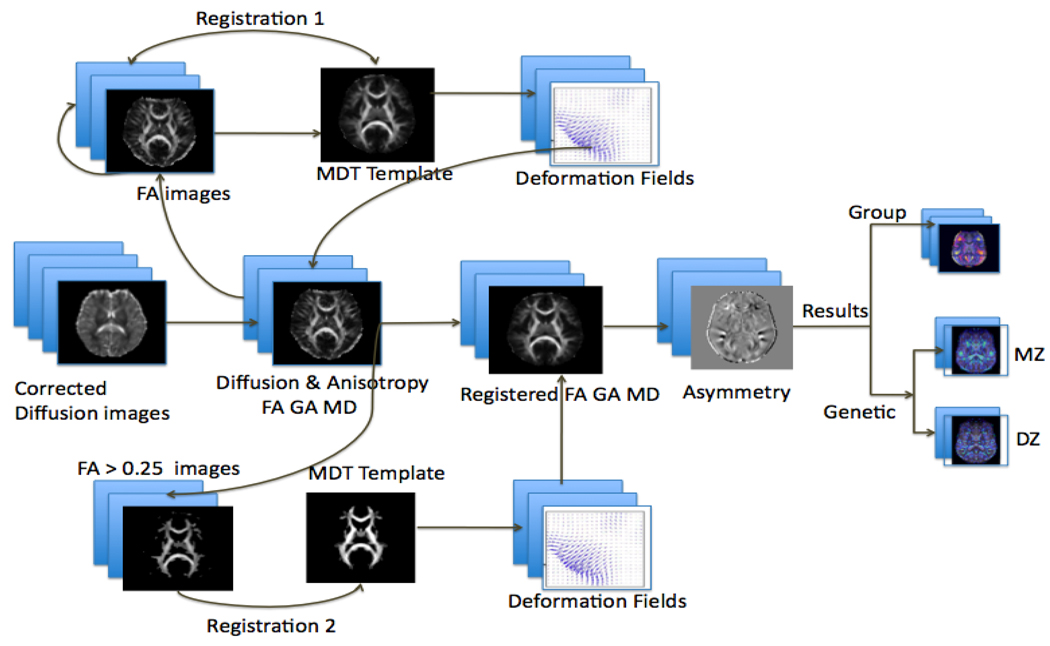
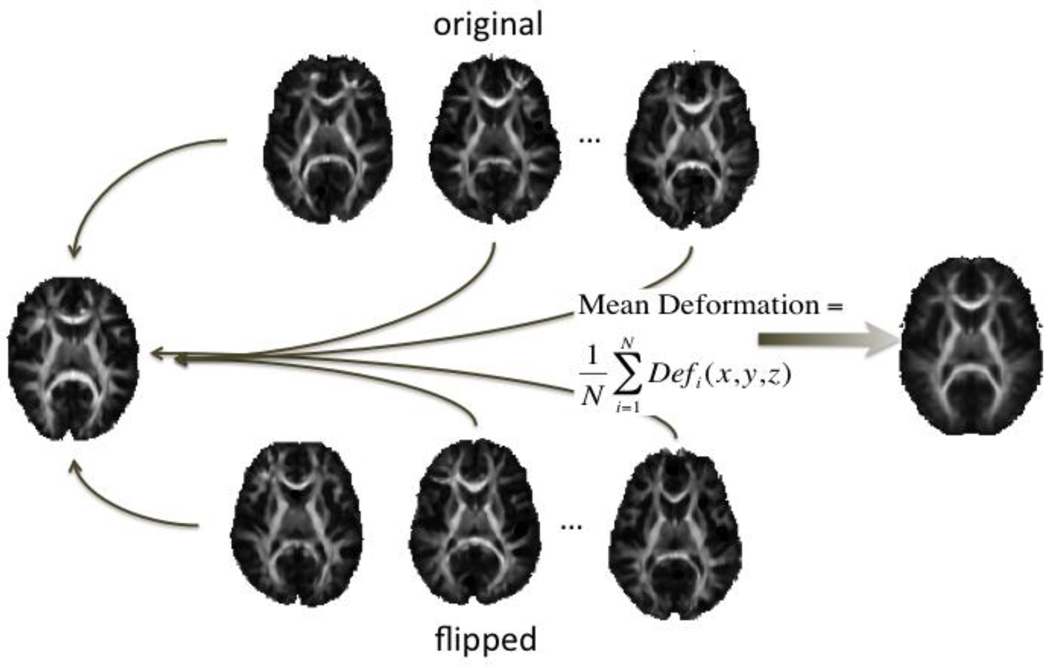
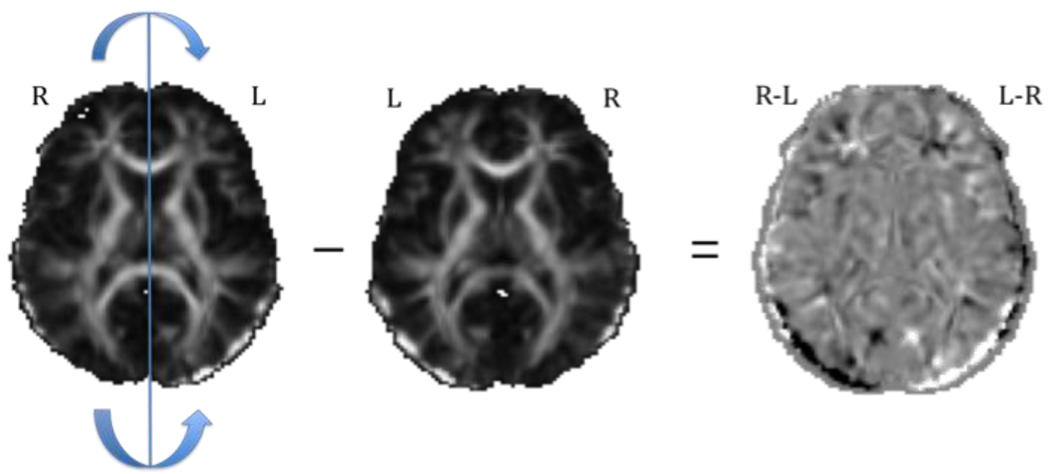
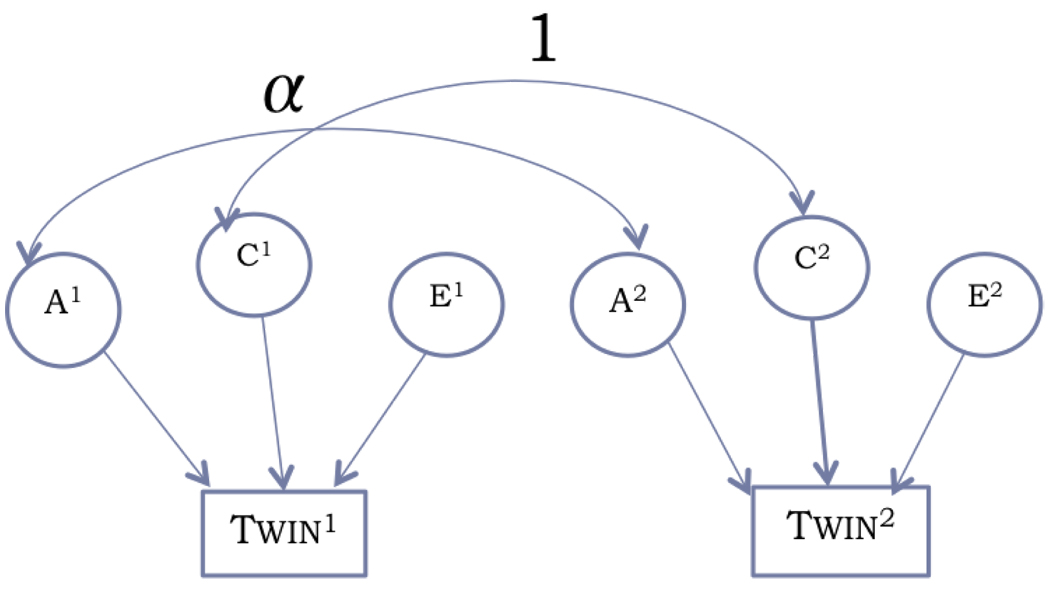
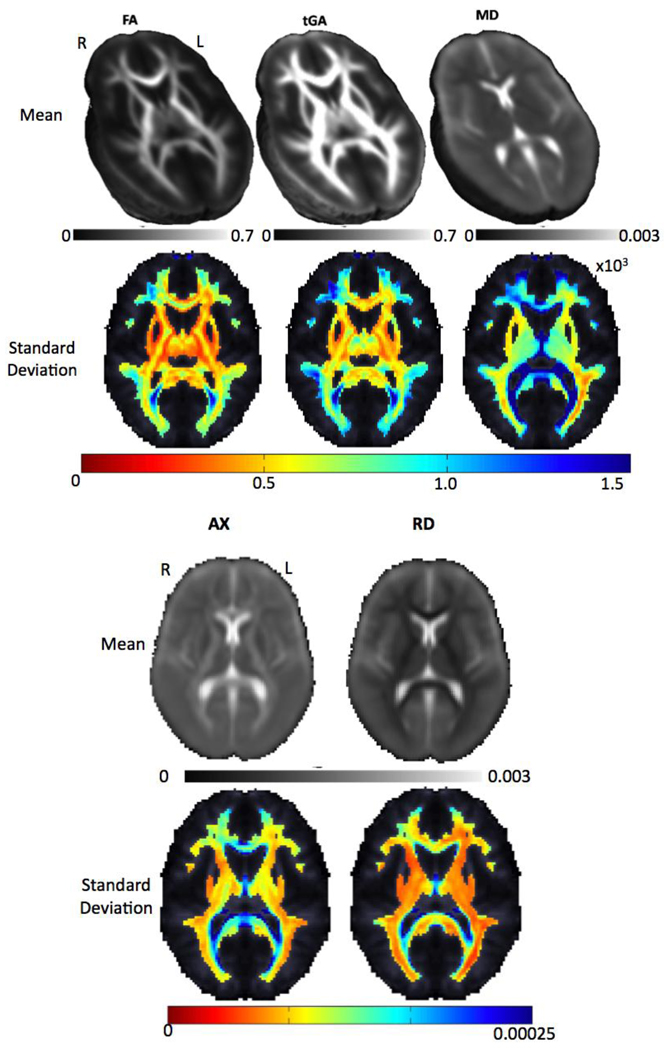
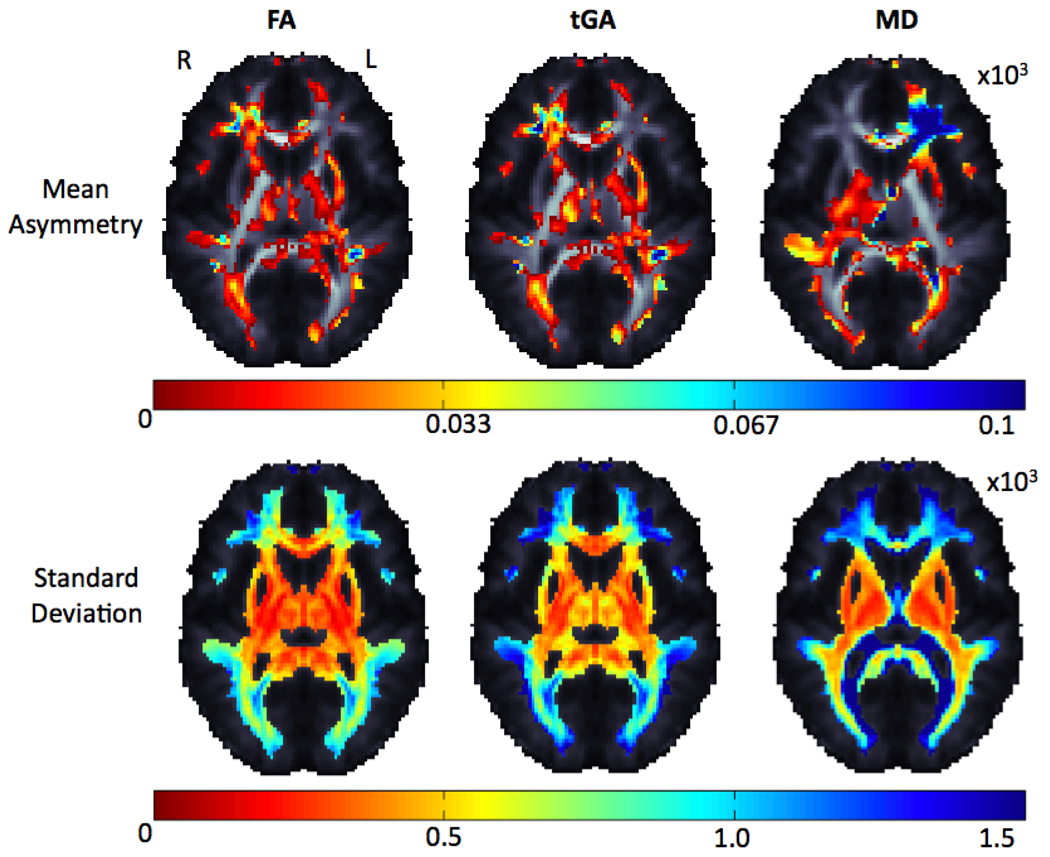
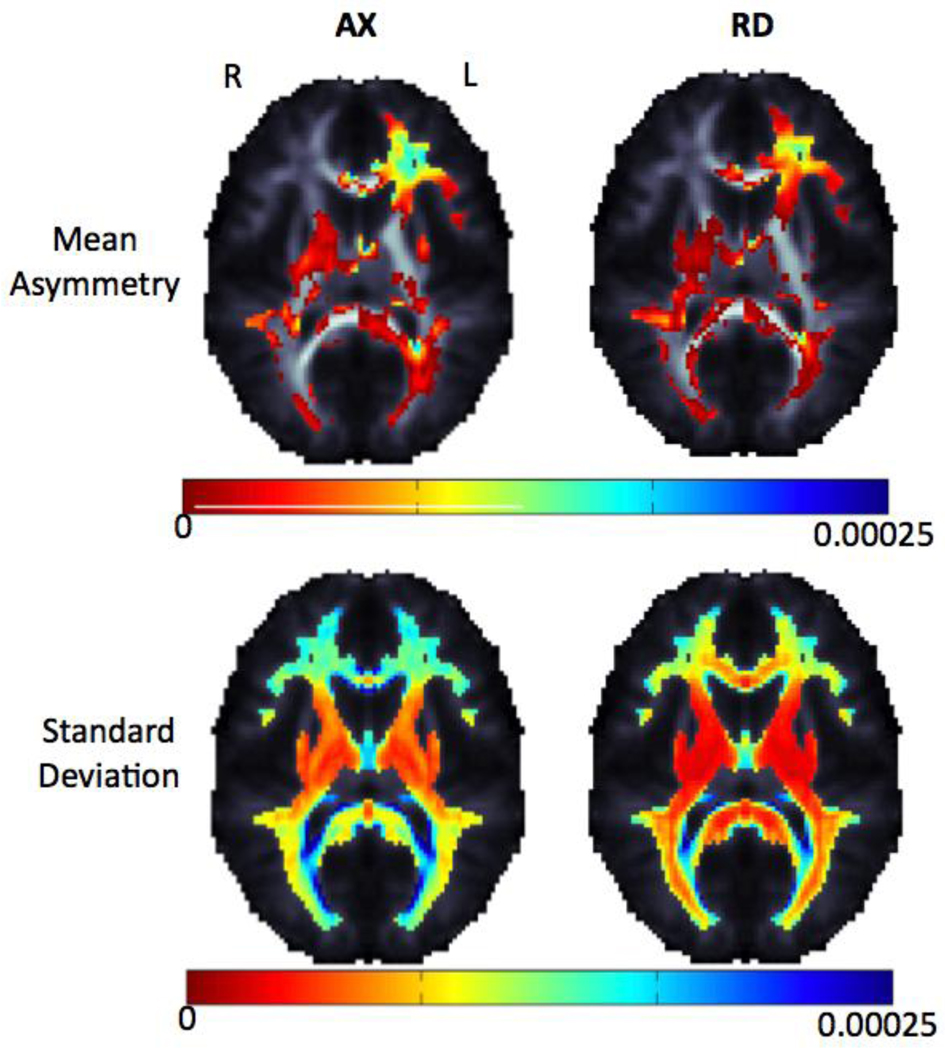
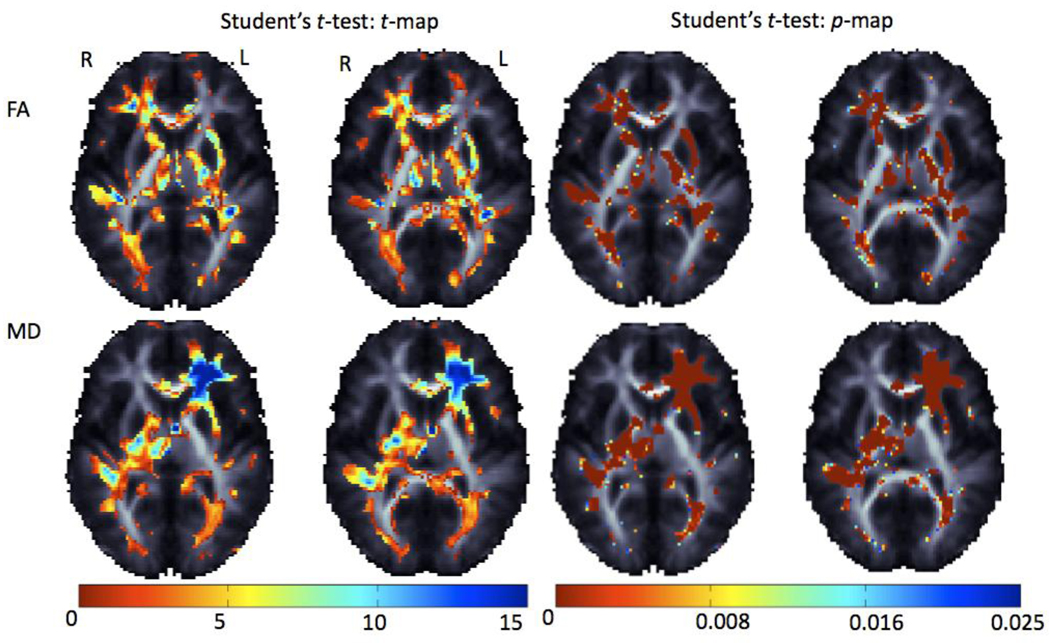
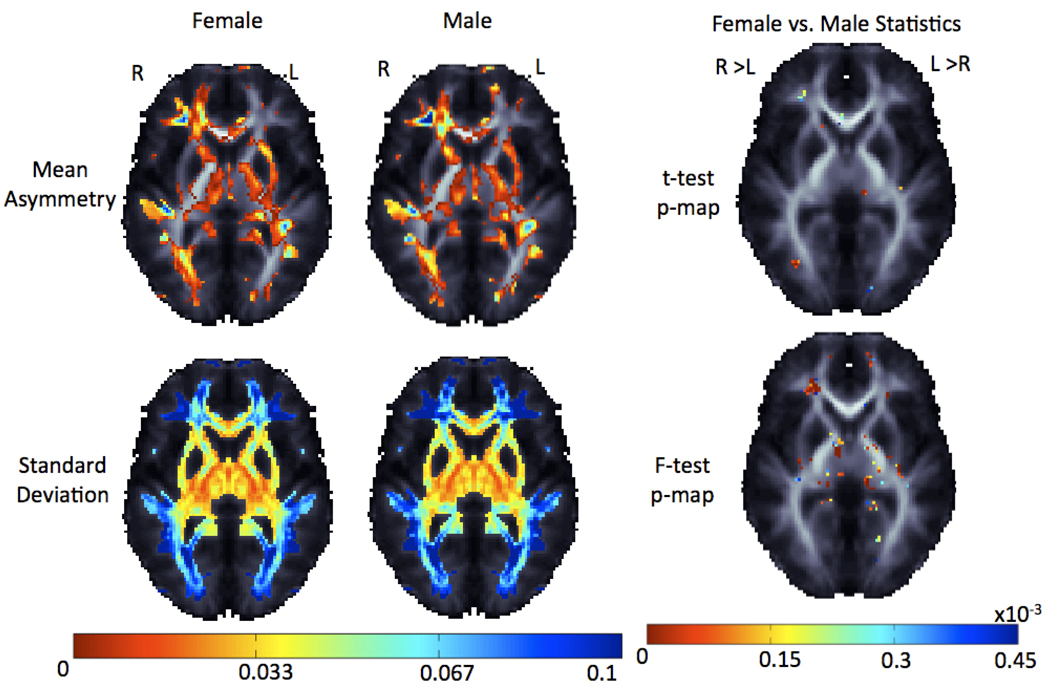
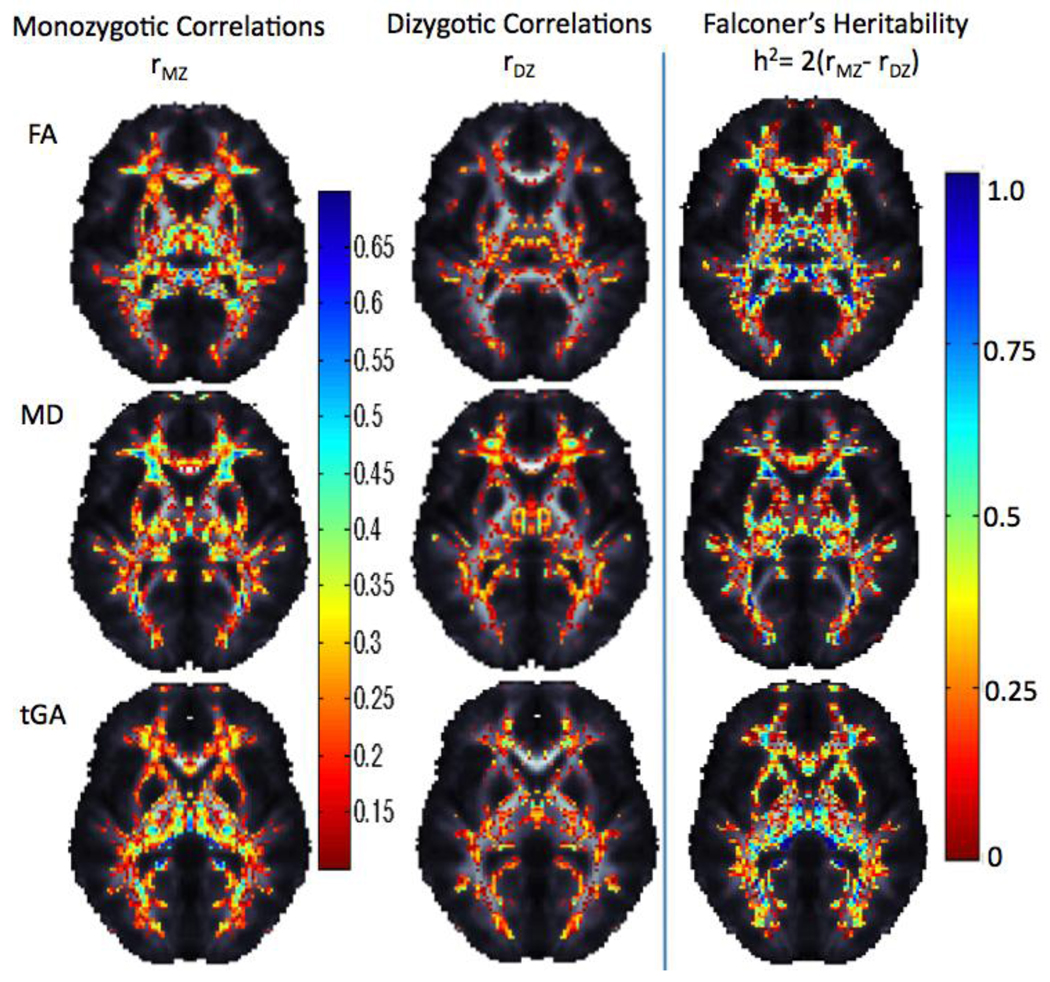
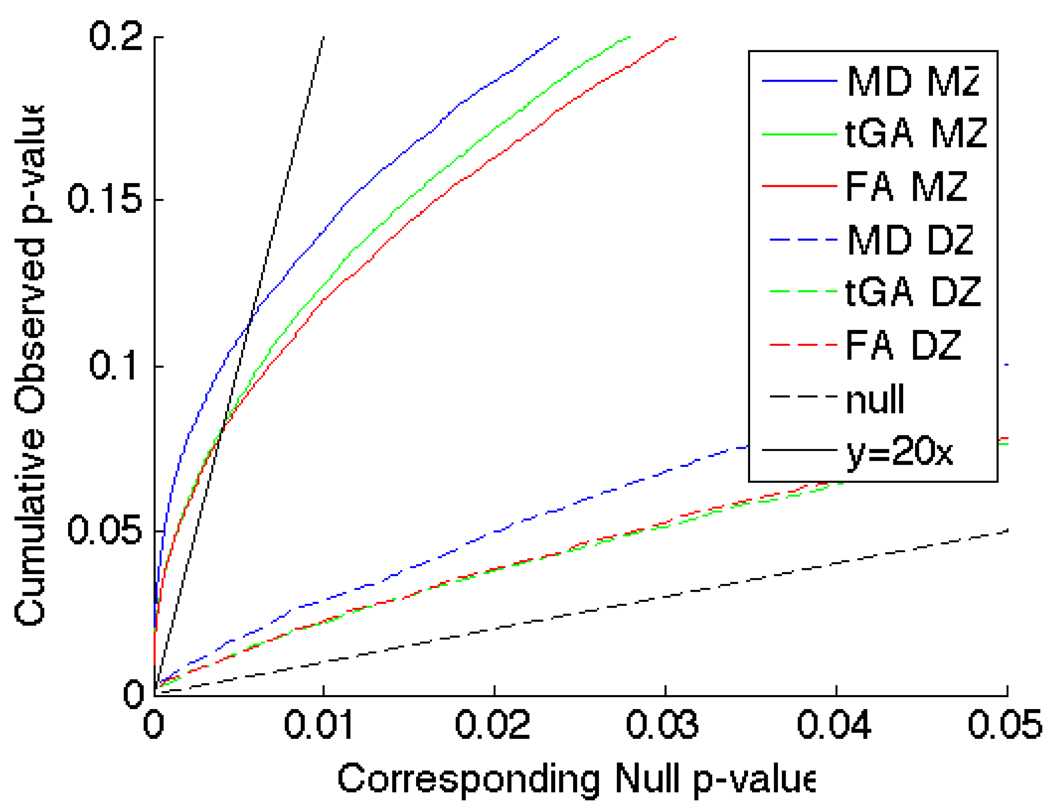
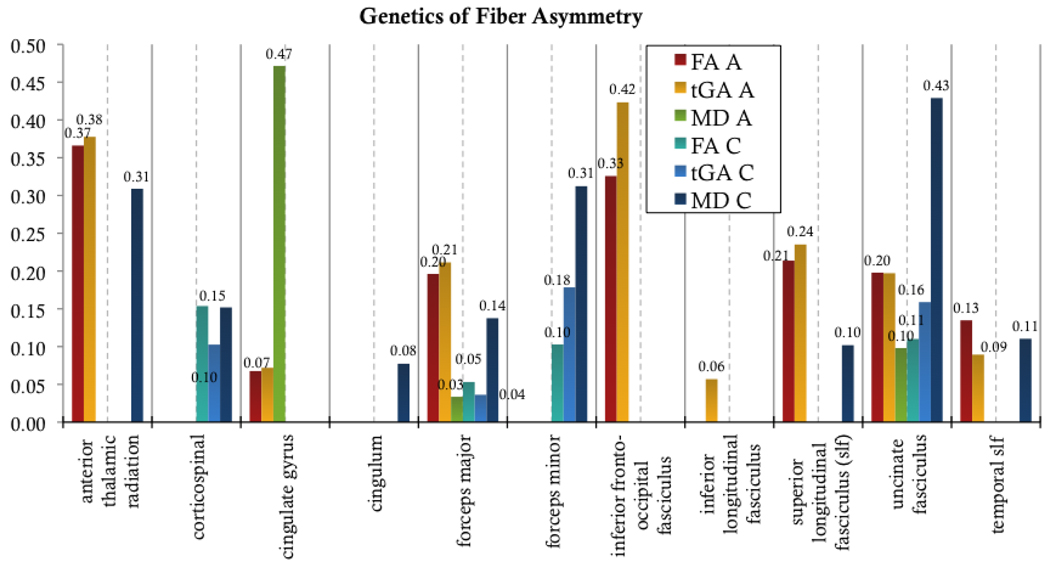
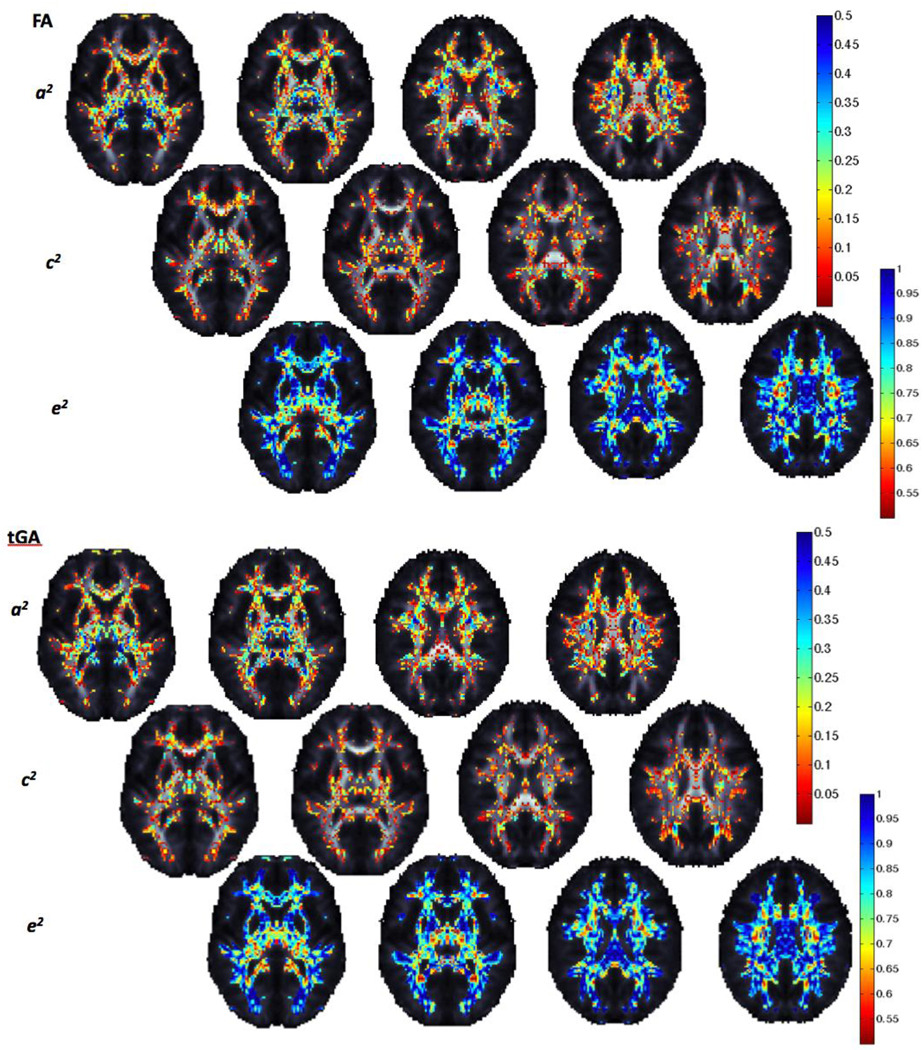
Brain asymmetry, or the structural and functional specialization of each brain hemisphere, has fascinated neuroscientists for over a century. Even so, genetic and environmental factors that influence brain asymmetry are largely unknown. Diffusion tensor imaging (DTI) now allows asymmetry to be studied at a microscopic scale by examining differences in fiber characteristics across hemispheres rather than differences in structure shapes and volumes. Here we analyzed 4Tesla DTI scans from 374 healthy adults, including 60 monozygotic twin pairs, 45 same-sex dizygotic pairs, and 164 mixed-sex DZ twins and their siblings; mean age: 24.4years+/-1.9 SD). All DTI scans were nonlinearly aligned to a geometrically-symmetric, population-based image template. We computed voxel-wise maps of significant asymmetries (left/right differences) for common diffusion measures that reflect fiber integrity (fractional and geodesic anisotropy; FA, GA and mean diffusivity, MD). In quantitative genetic models computed from all same-sex twin pairs (N=210 subjects), genetic factors accounted for 33% of the variance in asymmetry for the inferior fronto-occipital fasciculus, 37% for the anterior thalamic radiation, and 20% for the forceps major and uncinate fasciculus (all L>R). Shared environmental factors accounted for around 15% of the variance in asymmetry for the cortico-spinal tract (R>L) and about 10% for the forceps minor (L>R). Sex differences in asymmetry (men>women) were significant, and were greatest in regions with prominent FA asymmetries. These maps identify heritable DTI-derived features, and may empower genome-wide searches for genetic polymorphisms that influence brain asymmetry.


Figures

Figure 1
Figure 1
Flow chart of steps used to analyze DTI asymmetries. The non-diffusion-weighted images (also called b0 images) from all subjects were used to make a group “average-shape” brain, or mean deformation template (MDT), and they were nonlinearly registered to this template. The deformation fields were also applied to maps of mean diffusivity (MD) and anisotropy (FA, GA) to align them all to the common template. Statistical maps were made to show the mean level of asymmetry in different brain regions. Genetic analysis of the variance in fiber characteristics was performed at each location in the brain.
Figure 2
Figure 2
To create an MDT that was symmetrical by design, deformation fields - mapping images in their original orientation and others in the flipped orientation to the template - were averaged and applied to the template.
Figure 3
Figure 3
Maps of anisotropy asymmetry were created by reflecting every axial slice in the original image across midline and subtracting the flipped image from the original. Dark regions represent negative values; brighter (e.g., white) regions represent positive values.
Figure 4
Figure 4
Path diagram showing how various components in the structural equation model are related between each twin in a pair. α values are the only parameters that differ for each type of twin: α=1 for the MZ group and α=0.5 for the DZ group. Registration and measurement errors are included as part of the E component.
Figure 5
Figure 5
Average and standard deviation maps for FA, tGA, MD, axial and radial diffusivity from the 207 independent subjects used in this analysis. In the FA and tGA maps, fiber anisotropy is higher, as expected, in the deep white matter tracts (corpus callosum, internal capsule and corona radiata), and the variance in the DTI-derived measures is higher in the same regions (blue colors).
Figure 6
Figure 6
Average and standard deviation for FA, tGA, mean, axial and radial diffusivity asymmetry (left-right difference) maps are shown for 207 unrelated subjects. Only one twin per pair was used to ensure independent sampling. The dorsolateral pre-frontal cortex (DLPFC) and Meyer’s loop have strong asymmetries; also frontal lobe asymmetry is highly variable (bottom row – blue colors).
Figure 6
Figure 6
Average and standard deviation for FA, tGA, mean, axial and radial diffusivity asymmetry (left-right difference) maps are shown for 207 unrelated subjects. Only one twin per pair was used to ensure independent sampling. The dorsolateral pre-frontal cortex (DLPFC) and Meyer’s loop have strong asymmetries; also frontal lobe asymmetry is highly variable (bottom row – blue colors).
Figure 7
Figure 7
Pairwise t-tests show regions with inter-hemispheric differences in FA and MD, based on comparing images in their original orientation with their reflected versions. These maps visualize the effect size for the asymmetry (high in the DLPFC and Meyer’s loop). The p-values and absolute value of t are shown from this test – |t| values are as high as 15. Over 50% of the brain’s white matter (Table 1) shows detectable asymmetry.
Figure 8
Figure 8
Top row: Average FA asymmetry maps are shown for separate groups of 126 women and 81 men, all unrelated. One twin per pair was used, to ensure independent sampling and avoid including correlated observations. Sex differences (last column) were detected in the degree of fiber asymmetry. Men showed greater asymmetries than women, but these sex differences were detectable in <1% of the brain’s white matter. Bottom row: The standard deviation for asymmetry in each sex is presented along with the resulting p-map after a test for differences in within-group variance. Group differences in the variance of asymmetry are minor, but are more pronounced than the differences in asymmetry intensity itself.
Figure 9
Figure 9
Intraclass correlation maps for monozygotic and dizygotic twins along with Falconer’s heritability maps for asymmetries in FA, and tGA. In general, monozygotic twins have higher intra-pair correlations than dizygotic twins.
Figure 10
Figure 10
CDF plots of the distribution of the p-values obtained after non-parametric permutation testing, to account for multiple comparisons. For all measures, MZ and DZ twins showed significant intraclass correlations after multiple comparison correction using FDR. The MZ twin effects were much greater as denoted by the higher FDR-controlling critical p-values (i.e., the highest non-zero x-coordinate where the CDF crosses the y=20x line). These probabilities were obtained from pre-selected brain regions with average FA > 0.25, to avoid analyzing voxels with very low anisotropy.
Figure 11
Figure 11
A/C/E genetic results for fiber asymmetry per lobe. The proportion of variance (ranging from 0 to 1) due to each factor is shown for each region of interest. Both anisotropy measures show similar trends.
Figure 12
Figure 12
Voxelwise genetic analysis using the A/C/E model shows that most of the asymmetry in fiber integrity is attributable to unique environmental influences, random differences, and measurement error; in some frontal and temporo-parietal regions, ~50% of the differences across hemispheres are due to genetic differences. Geodesic anisotropy measures may be marginally better for detecting genetic effects on fiber asymmetry, but maps for both DTI-derived indices were very similar.

References

    1. Annett M. Handedness and cerebral dominance: the right shift theory. J Neuropsychiatry Clin Neurosci. 1998;10(4):459–469. - PubMed
    1. Annett M. A classification of hand preference by association analysis. British Journal of Psychology. 1970;61:303–321. - PubMed
    1. Ardekani S, Kumar A, Bartzokis G, Sinha U. Exploratory voxel-based analysis of diffusion indices and hemispheric asymmetry in normal aging. Magnetic Resonance Imaging. 2007;25(2):154–167. - PubMed
    1. Arsigny V, Fillard P, Pennec X, Ayache N. Log-Euclidean metrics for fast and simple calculus on diffusion tensors. MRM. 2006;56(2):411–421. - PubMed
    1. Ashburner J, Friston KJ. Voxel-based morphometry–the methods. NeuroImage. 2000;11(6):805–821. - PubMed

Publication types

LinkOut - more resources