. 2010 Jun;20(6):761-70.
doi: 10.1101/gr.099655.109. Epub 2010 Apr 29.

Evolutionarily conserved replication timing profiles predict long-range chromatin interactions and distinguish closely related cell types

Affiliations

Evolutionarily conserved replication timing profiles predict long-range chromatin interactions and distinguish closely related cell types

Tyrone Ryba et al. Genome Res. 2010 Jun.

Abstract

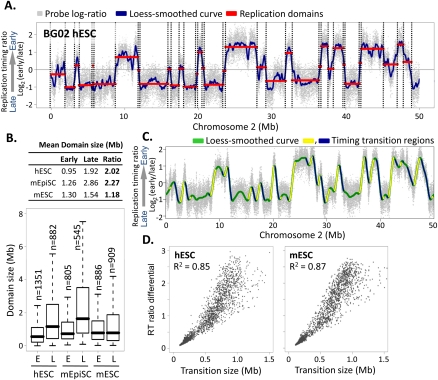
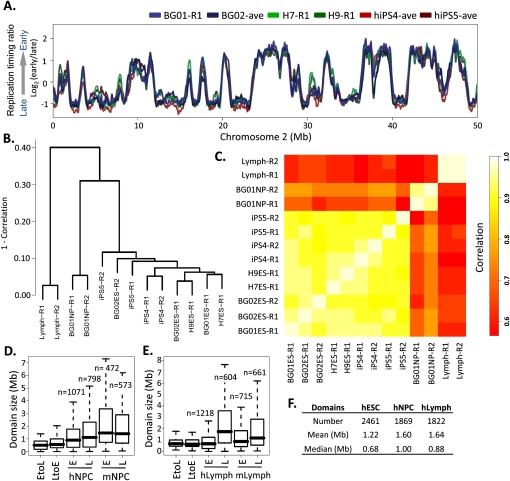
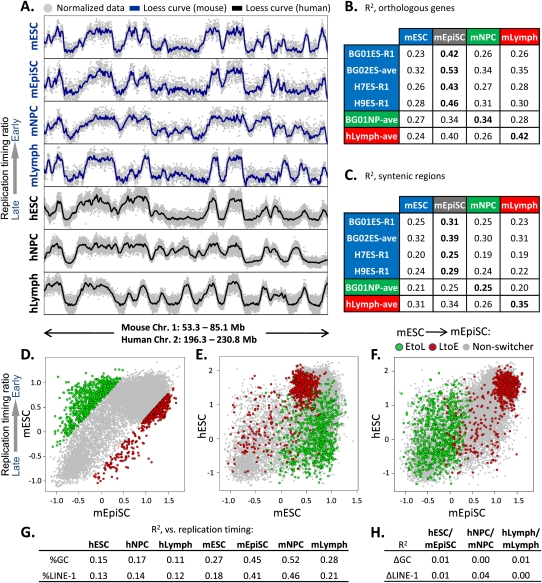
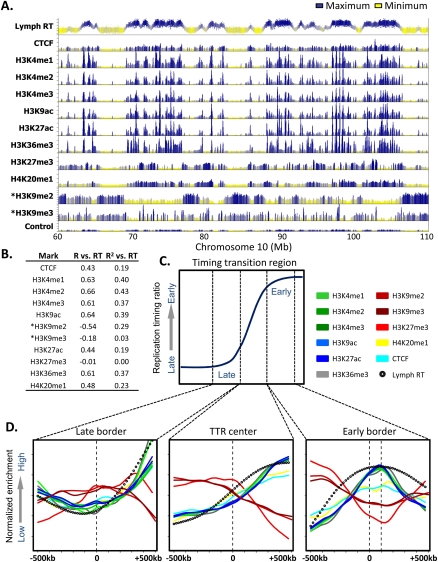
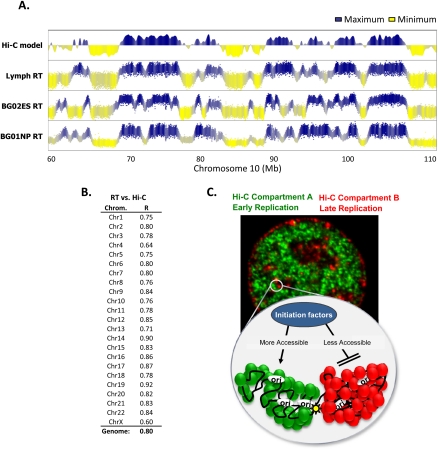
To identify evolutionarily conserved features of replication timing and their relationship to epigenetic properties, we profiled replication timing genome-wide in four human embryonic stem cell (hESC) lines, hESC-derived neural precursor cells (NPCs), lymphoblastoid cells, and two human induced pluripotent stem cell lines (hiPSCs), and compared them with related mouse cell types. Results confirm the conservation of coordinately replicated megabase-sized "replication domains" punctuated by origin-suppressed regions. Differentiation-induced replication timing changes in both species occur in 400- to 800-kb units and are similarly coordinated with transcription changes. A surprising degree of cell-type-specific conservation in replication timing was observed across regions of conserved synteny, despite considerable species variation in the alignment of replication timing to isochore GC/LINE-1 content. Notably, hESC replication timing profiles were significantly more aligned to mouse epiblast-derived stem cells (mEpiSCs) than to mouse ESCs. Comparison with epigenetic marks revealed a signature of chromatin modifications at the boundaries of early replicating domains and a remarkably strong link between replication timing and spatial proximity of chromatin as measured by Hi-C analysis. Thus, early and late initiation of replication occurs in spatially separate nuclear compartments, but rarely within the intervening chromatin. Moreover, cell-type-specific conservation of the replication program implies conserved developmental changes in spatial organization of chromatin. Together, our results reveal evolutionarily conserved aspects of developmentally regulated replication programs in mammals, demonstrate the power of replication profiling to distinguish closely related cell types, and strongly support the hypothesis that replication timing domains are spatially compartmentalized structural and functional units of three-dimensional chromosomal architecture.


Figures

Figure 1.
Figure 1.
Structure and conservation of replication domains in hESCs. (A) Replication timing profile across a 50-Mb segment of human chromosome 2. Data shown are the average of two replicate hybridizations (dye-swap) for hESC line BG02. DNA synthesized early vs. late during S phase was hybridized to an oligonucleotide microarray, and the log2 ratio of early/late signal for each probe (probe spacing 1.1 kb) across the genome was plotted on the y-axis vs. map position on the x-axis. (Gray dots) Raw data. (Blue line) Loess-smoothed data. Replication domains (red lines) and boundaries (dotted lines) were identified by circular binary segmentation (Venkatraman and Olshen 2007). (B) Table (top) and box plots (bottom) of the sizes of early (RT > 0) vs. late (RT < 0) replication domains in hESCs (BG02), mESCs (D3), and mEpiSCs, with the ratio of late to early domain sizes. Horizontal bars for each box plot represent the 10th, 25th, 50th (median), 75th, and 90th percentiles. (C) Identification of timing transition regions (TTRs; blue and yellow highlight alternating TTRs) from loess-smoothed RT profiles. (Green) BG02 hESC. (D) Analysis of replication timing differential vs. physical distance for TTRs >100 kb in BG02 hESCs and D3 mESCs.
Figure 2.
Figure 2.
Cell-state specificity of replication profiles. (A) Conservation of replication timing among cell lines BG01, BG02, and H7 shown by loess-smoothed replication profiles generated as in Figure 1. Genome-wide, pairwise Pearson R2 values can be found in Supplemental Figure S3D. (B) Hierarchical clustering of individual RT profile replicates in 12,640 200-kb windows. The height of horizontal bars depicts the relative similarity between clusters, with more similar clusters lower on the graph. (R1) Replicate 1, (R2) replicate 2. (C) Correlation matrix of hESC, hiPSC, hNPC, and lymphoblast replicate profiles averaged in 200-kb windows as in B. Heat map (right) provides a gauge of the relative similarities of data sets to each other. (D,E). Size distribution of EtoL and LtoE switching domains and early vs. late domains in human vs. mouse NPCs (G) and lymphoblasts (H), calculated as in Figure 1B. Data for mNPCs are from Hiratani et al. (2008). (F) Summary of domain numbers and sizes.
Figure 3.
Figure 3.
Significant conservation of replication timing between hESCs and mEpiSCs. (A) Example of RT conservation between the indicated human and mouse cell types in one of 207 syntenic regions. (B) Correlation of replication timing (R2 values) between the indicated human and mouse cell types at 16,629 orthologous gene promoters. All mouse data are the averages of biological replicates, while both averaged replicates (ave) and exemplary single replicates (R1) are shown for human cell types. R2 differences ≥0.02 are statistically significant at P < 0.05 using Fisher R-to-Z transformation. (C) 207 syntenic regions >1 Mb were loess smoothed, and RT values were gathered at 100 equal intervals per window to obtain correlations of replication timing in syntenic regions. The significance of these alignments was calculated using bootstrapping (P < 0.0001), as described in the Methods. (DF) Replication timing for orthologous genes with the top 5% of EtoL and LtoE timing changes in mESCs vs. mEpiSCs (D; [green] EtoL, [red] LtoE, [gray] non-switching) was compared with BG01 hESCs (E,F). Genes that transition from EtoL between mESCs and mEpiSCs generally remain late-replicating in hESCs. (G) Pearson R2 values between domain-wide replication timing and LINE-1 density or GC content are shown for the cell types indicated. Mouse data are from Hiratani et al. (2008, . (H) Conservation (R2) between syntenic regions as in Figure 3C shows little relationship to differences in regional GC or LINE-1 content.
Figure 4.
Figure 4.
A chromatin signature for replication domain boundaries. (A) Profiles of lymphoblastoid replication timing, CTCF, and the indicated histone modifications are shown for a representative 50-Mb region of chromosome 10. ChIP-seq data and the input control profile are from GM12878 lymphoblastoid ChIP-seq experiments hosted on the UCSC Genome Browser (Rosenbloom et al. 2010), with the exception of H3K9me2 and H3K9me3 (asterisk), obtained from CDT4+ T-cells (Barski et al. 2007). (B) Domain-wide relationship between replication timing and histone modifications. Pearson R and R2 values of domain replication timing with each mark above were calculated as in Hiratani et al. (2008). (C) A diagrammatic timing transition region, in which windows of 1 Mb surrounding the late border, center, and early border are highlighted. (D) Average profiles of histone marks, CTCF, and replication timing are shown for the windows indicated in C.
Figure 5.
Figure 5.
Replication timing predicts long-range chromatin interactions. (A) Profiles of lymphoblastoid replication timing and a model of self-interacting regions of open or closed chromatin (Hi-C–positive values = open; Lieberman-Aiden et al. [2009]). hNPC and hESC replication profiles are shown alongside to illustrate cell-type specificity of the alignment. (B) The correlation between replication timing and the Hi-C chromatin interaction model for each chromosome is shown, calculated as for other epigenetic marks in Figure 4B. (C) Speculative model synthesizing the concepts revealed in Figures 4 and 5. The microscope image is a mouse fibroblast, pulse-labeled with iododeoxyuridine (IdU) early in S phase (green), subsequently pulse-labeled with chlorodeoxyuridine (CldU) late in S phase (red), and then immunofluorescently labeled with antibodies specific to each halogenated nucleotide, as in Wu et al. (2005) and Yokochi et al. (2009). This reveals the spatial compartmentalization of early and late replicating DNA, which is also supported by the reduced frequency of interaction between chromosomal sequences in Hi-C compartments A (green) and B (red). The cartoon is a schematic view of a pair of adjacent early (green) and late replicating (red) domains that are bounded at the early domain side by enrichment of active chromatin marks (yellow star). The replication domains resemble fractal globules described by (Lieberman-Aiden et al. (2009), and late and early domains are spatially separated by a large TTR. Late replicating Hi-C compartment B has a higher frequency of interactions, indicative of more condensed chromatin, which here is proposed to be less accessible to initiation factors for replication than early replicating Hi-C compartment A. (Green and red circles) Different protein components of early vs. late replicating chromatin.

Comment in

  • Tying replication to cell identity.
    Egli D, Le Bin GC. Egli D, et al. Nat Rev Mol Cell Biol. 2013 Jun;14(6):326. doi: 10.1038/nrm3593. Nat Rev Mol Cell Biol. 2013. PMID: 23698578 No abstract available.

References

    1. Arney KL, Fisher AG 2004. Epigenetic aspects of differentiation. J Cell Sci 117: 4355–4363 - PubMed
    1. Barski A, Cuddapah S, Cui K, Roh TY, Schones DE, Wang Z, Wei G, Chepelev I, Zhao K 2007. High-resolution profiling of histone methylations in the human genome. Cell 129: 823–837 - PubMed
    1. Bolstad BM, Irizarry RA, Astrand M, Speed TP 2003. A comparison of normalization methods for high density oligonucleotide array data based on variance and bias. Bioinformatics 19: 185–193 - PubMed
    1. Boyer LA, Lee TI, Cole MF, Johnstone SE, Levine SS, Zucker JP, Guenther MG, Kumar RM, Murray HL, Jenner RG, et al. 2005. Core transcriptional regulatory circuitry in human embryonic stem cells. Cell 122: 947–956 - PMC - PubMed
    1. Brons IG, Smithers LE, Trotter MW, Rugg-Gunn P, Sun B, Chuva de Sousa Lopes SM, Howlett SK, Clarkson A, Ahrlund-Richter L, Pedersen RA, et al. 2007. Derivation of pluripotent epiblast stem cells from mammalian embryos. Nature 448: 191–195 - PubMed

Publication types

Associated data