. 2010 Sep;24(9):3341-50.
doi: 10.1096/fj.10-158782. Epub 2010 Apr 29.

Gene expression atlas for human embryogenesis

Affiliations

Gene expression atlas for human embryogenesis

Hong Yi et al. FASEB J. 2010 Sep.

Abstract

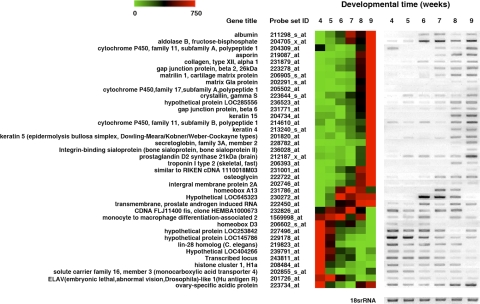
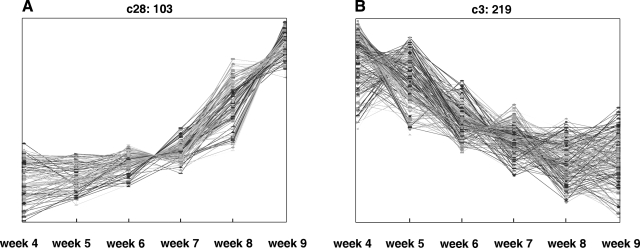
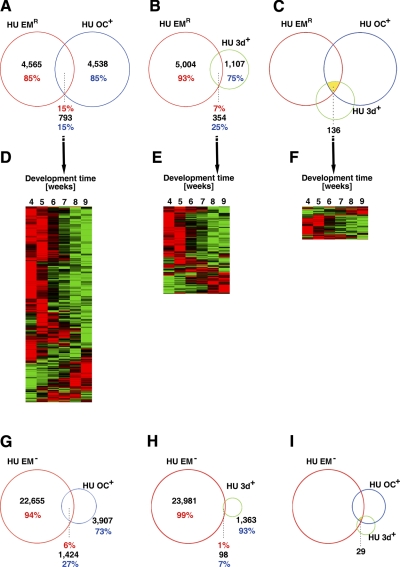
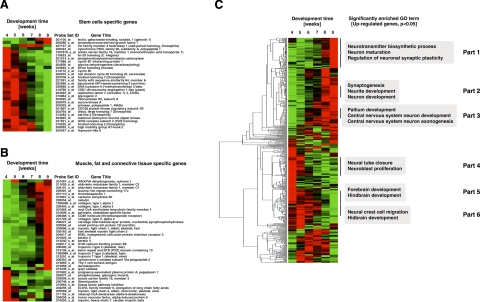
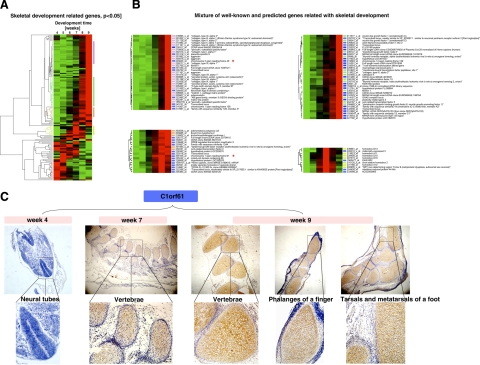
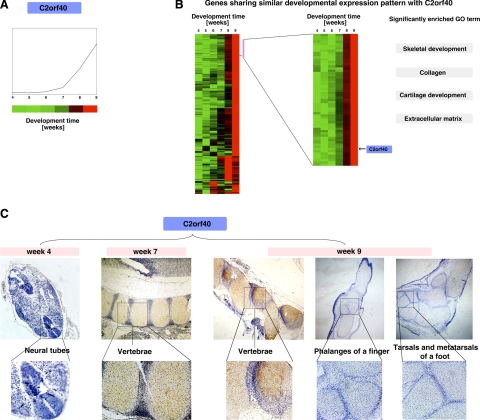
Human embryogenesis is believed to involve an integrated set of complex yet coordinated development of different organs and tissues mediated by the changes in the spatiotemporal expression of many genes. Here, we report a genome-wide expression analysis during wk 4-9 of human embryogenesis, a critical period when most organs develop. About half of all human genes are expressed, and 18.6% of the expressed genes were significantly regulated during this important period. We further identified >5000 regulated genes, most of which previously were not known to be associated with animal development. Our study fills an important gap in mammalian developmental studies by identifying functional pathways involved in this critical but previously not studied period. Our study also revealed that the genes involved here are distinct from those during early embryogenesis, which include three groups of maternal genes. Furthermore, we discovered that genes in a given developmental process are regulated coordinately. This led us to develop an easily searchable database of this entire collection of gene expression profiles, allowing for the identification new genes important for a particular developmental process/pathway and deducing the potential function of a novel gene. The validity of the predictions from the database was demonstrated with two examples through spatiotemporal analyses of the two novel genes. Such a database should serve as a highly valuable resource for the molecular analysis of human development and pathogenesis.


Figures

Figure 1.
Figure 1.
RT-PCR analysis validated the findings from the microarrays. RT-PCR analysis was performed for 38 regulated genes. The results appear to the right of the microarray data for each gene. The color scale at top left indicates the relative levels of expression. Red and green indicate high and low expression levels, respectively. 18S rRNA was analyzed as a loading control.
Figure 2.
Figure 2.
SOM cluster analysis of the developmentally regulated genes. Of the 42 clusters, 2 are shown here as examples. The heading of each panel indicates the index of the cluster in the full SOM, followed by the number of genes in the cluster (Supplemental Fig. 1). A) Genes whose expression increased throughout the developmental period (cluster c28 with 103 genes). B) Genes whose expression decreased throughout the developmental period (c3 with 219 genes).
Figure 3.
Figure 3.
Venn diagrams showing that a number of genes that are highly expressed in human oocytes and 3-d-old embryos are repressed during wk 4–9. A, B) Venn diagrams between genes whose expression changed significantly during wk 4–9 of human embryogenesis (HU EMR) and genes that were highly expressed in the human oocyte (HU OC+) (A) or in 3-d-old human embryos (HU 3d+) (B). C) Venn diagram showing genes regulated during wk 4–9 that were also highly expressed in the oocyte and 3-d-old embryo. D, F) The expression profiles of the common genes in AC, respectively. Note that the expression of the majority of the genes was repressed by wk 9. Red and green indicate high and low expression levels, respectively. G, H) Venn diagrams between genes with no detectable expression during wk 4–9 and genes highly expressed in human oocyte (G) or 3-d-old embryos (H). I) Venn diagram showing genes with no detectable expression during wk 4–9 but high levels of expression in the oocyte and 3-d-old embryo.
Figure 4.
Figure 4.
Coordinated regulation of genes involved in the same biological processes. A) Stem cell-specific genes among the 5358 regulated genes were gradually down-regulated during wk 4–9. B) Most of the genes that were specific to muscle, fat, and connective tissue were up-regulated during wk 4–9. C) The sequential but coordinated expression of specific genes correlated with the different stages of development of the nervous system. Note that genes in GO categories associated with different aspects of the development of the nervous system clustered together; some clusters were expressed early whereas others were expressed late in embryogenesis.
Figure 5.
Figure 5.
Clustering of gene expression profiles identified novel genes potentially involved in skeletal development. A) 148 genes among the genes regulated during wk 4–9 were found to be in GO categories associated with skeletal development and were clustered based on their expression patterns. Four clusters indicated with colored bars were used for further analysis. B) The 148 genes were clustered with the 1218 genes whose GO categories were unknown, and the genes in the four color-coded clusters shown in A were identified in the combined clusters. The clusters that were highly enriched for the genes in the four color-coded clusters in A were identified and shown in the four panels here. The genes indicated with a blue bar are genes of unknown GO categories, whereas those labeled with colored bars correspond to the genes in A. The red stars indicate 2 unknown genes, C2orf40 (chromosome 2 open reading frame 40) (top left panel) and C1orf61 (chromosome 1 open reading frame 61) (bottom left panel), that were used as examples in this study (Fig. 6 and C, respectively). C) In situ hybridization confirmed that C1orf61 was indeed involved in skeletal development. Cells with brown/yellow stains were considered positive. Note that C1orf61 was expressed at very low levels in wk 4 but was highly up-regulated in the skeletal system, including the vertebrae and limbs, by wk 7–9.
Figure 6.
Figure 6.
Gene expression pattern searches revealed that C2orf40 was involved in skeletal development. A) The C2orf40 expression profile as obtained from our expression database. B) Approximately 500 genes clustered close to C2orf40 (left panel), revealing the existence of different expression patterns. The cluster of genes with the most similar expression pattern as that of C2orf40, indicated by the purple bar on the right, was expanded (right panel, with the location of C2orf40 indicated). Some significant GO categories associated with these clusters are shown on the right; they are all associated with skeletal development. C) In situ hybridization showed that C2orf40 was up-regulated in the vertebrae by wk 7–9. Cells with brown/yellow stains were considered positive. Note that C2orf40 had little expression in the limbs, different from the expression of C1orf61.

References

    1. Lindsay S, Copp A J. MRC-Wellcome Trust Human Dev. Biol. Resource: enabling studies of human developmental gene expression. Trends Genet. 2005;21:586–590. - PubMed
    1. Arbeitman M N, Furlong E E, Imam F, Johnson E, Null B H, Baker B S, Krasnow M A, Scott M P, Davis R W, White K P. Gene expression during the life cycle of Drosophila melanogaster. Science. 2002;297:2270–2275. - PubMed
    1. Hill A A, Hunter C P, Tsung B T, Tucker-Kellogg G, Brown E L. Genomic analysis of gene expression in C. elegans. Science. 2000;290:809–812. - PubMed
    1. White K P, Rifkin S A, Hurban P, Hogness D S. Microarray analysis of Drosophila development during metamorphosis. Science. 1999;286:2179–2184. - PubMed
    1. Zhang W, Morris Q D, Chang R, Shai O, Bakowski M A, Mitsakakis N, Mohammad N, Robinson M D, Zirngibl R, Somogyi E, Laurin N, Eftekharpour E, Sat E, Grigull J, Pan Q, Peng W T, Krogan N, Greenblatt J, Fehlings M, van der Kooy D, Aubin J, Bruneau B G, Rossant J, Blencowe B J, Frey B J, Hughes T R. The functional landscape of mouse gene expression. J Biol. 2004;3:21. - PMC - PubMed

Publication types

MeSH terms