

Review
doi: 10.1152/physiol.00001.2010.
Lessons from photoreceptors: turning off g-protein signaling in living cells
Affiliations
- PMID: 20430952
- PMCID: PMC2880230
- DOI: 10.1152/physiol.00001.2010
Item in Clipboard
Review
Lessons from photoreceptors: turning off g-protein signaling in living cells
Physiology (Bethesda).
2010 Apr.
Abstract
Phototransduction in retinal rods is one of the most extensively studied G-protein signaling systems. In recent years, our understanding of the biochemical steps that regulate the deactivation of the rod's response to light has greatly improved. Here, we summarize recent advances and highlight some of the remaining puzzles in this model signaling system.
Figures
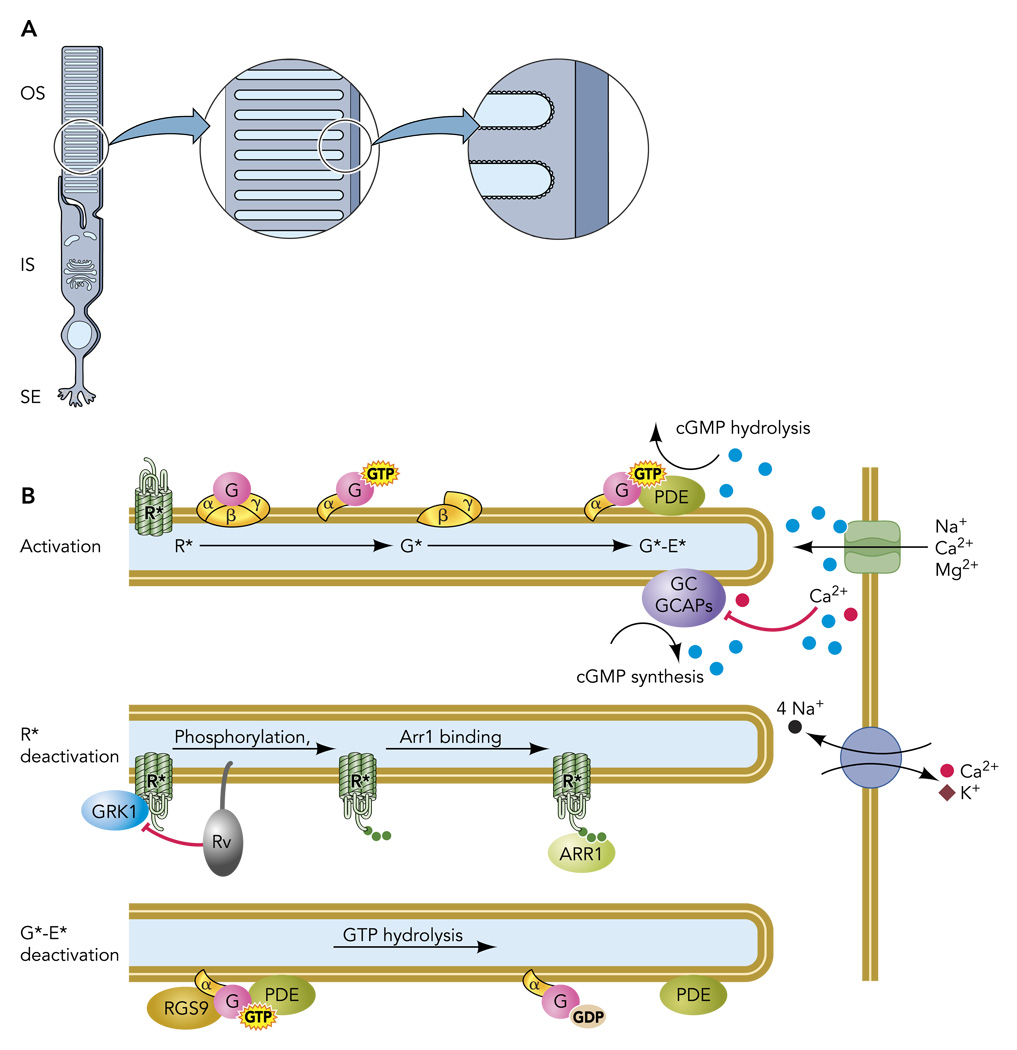
A: rod photoreceptors are highly compartmentalized cells, with most organelles retained in the inner segment (IS) and synaptic ending (SE). The specialized outer segment (OS) is filled with a stack of intracellular membranous discs that house the transduction machinery. B: schematic of a portion of three disc membranes and plasma membrane shown in A, illustrating activation and deactivation reactions.
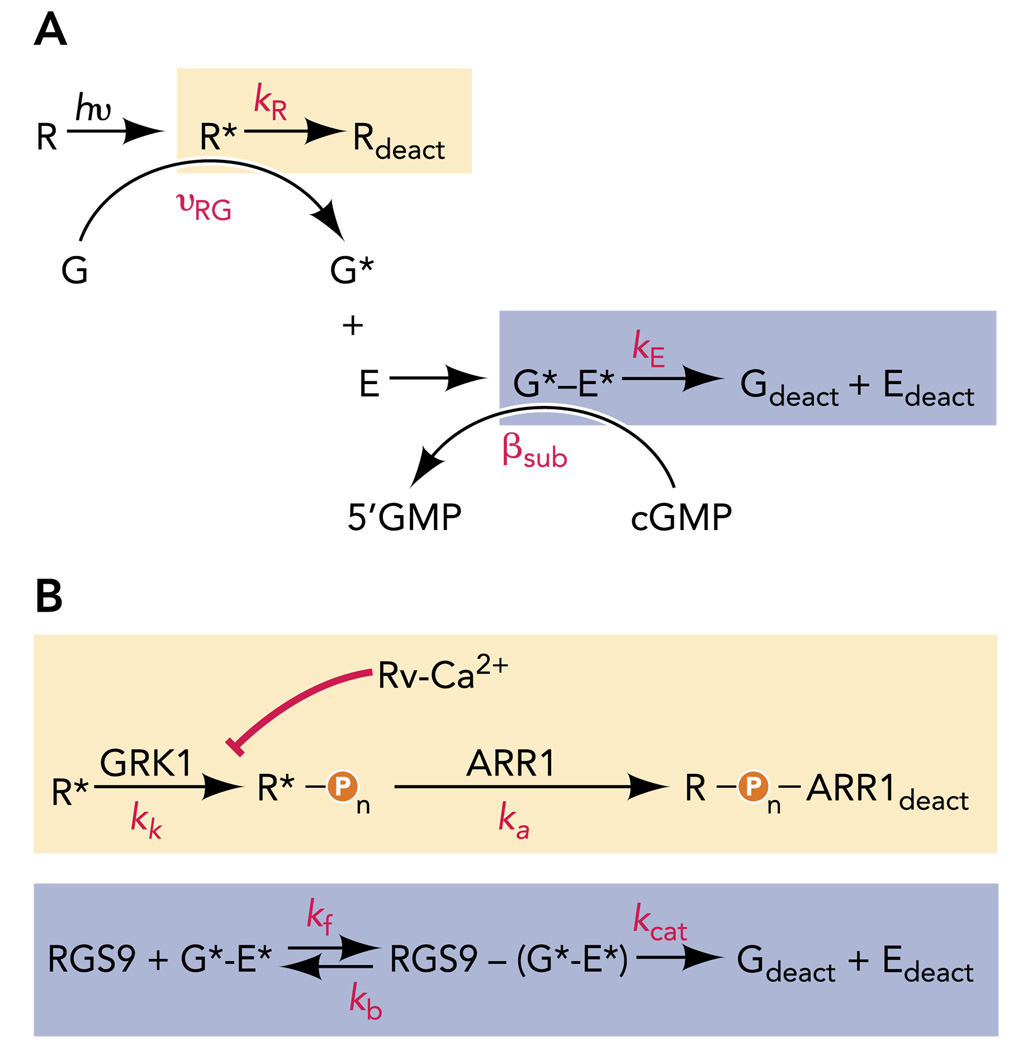
A: standard schemes for R* and G*-E* deactivation, each assuming a single rate constant (kR or kE, respectively) for the shut-off reactions. B: expanded schemes for the deactivation events boxed in A, which include rate constants for kinase (kk) and arrestin (ka) actions known to be essential for R* deactivation and the forward (kf), reverse (kb), and catalytic (kcat) rate constants needed to describe the RGS9-catalyzed GTP hydrolysis needed for G*-E* deactivation.
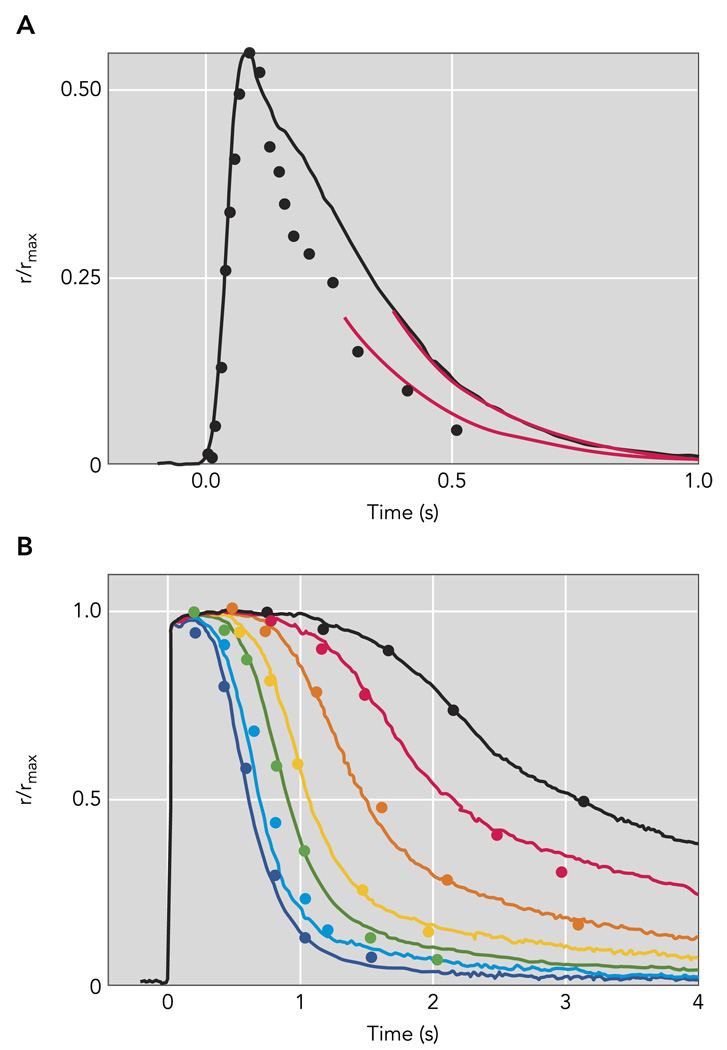
A: rod photoresponse extracted from paired-flash ERG experiments of Hetling and Pepperberg (symbols; Ref. ; Figure 5B); flash produced a response of ~55% the saturating a-wave amplitude corneal ERG a-waves (symbol). The black trace is a population average half-maximal response from 15 c57Bl/6 mouse rods recorded with suction electrodes; the flash strength was 48 photons/µm2. Red curves are exponential functions, both with a 202-ms time constant. B: paired-flash mouse a-wave data of Lyubarsky and Pugh (1996) for a series of flashes of increasing strength that completely suppressed the a-wave (symbols) are compared with population average suction electrode recordings (smooth traces) from 15 mouse rods made in bicarbonate-buffered Locke’s solution at 37°C to flashes that ranged from 580 to 25,200 pho-tons/µm2 by factors of 2. The average maximal response amplitude for the suction electrode recordings in A and B was 16.5 pA; the average effective collecting area was 0.50 µm2.
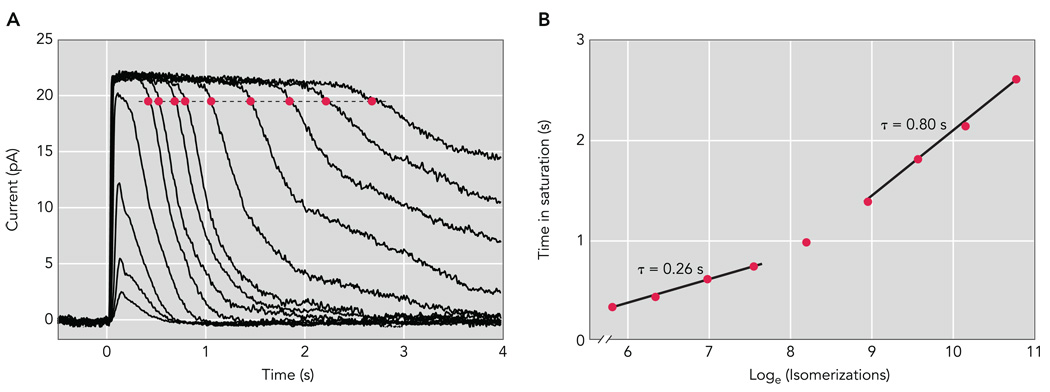
A: population average response family from a Sv129 mouse rod. Brief (10 ms) flashes were delivered at t = 0 s and ranged in strength from 7.78 to 85,600 photons/µm2 by factors of 2–4. B: Pepperberg plot of wild-type mouse rods. The time that a bright flash response remained in saturation (Tsat) is plotted as a function of the natural logarithm of the flash strength in photoisomerizations per flash (R*). The slopes of the fitted lines, 0.26 and 0.80 s, give the dominant time constants of recovery over the respective range of flash strengths.
References
-
- Arshavsky VY, Lamb TD, Pugh EN., Jr G proteins and phototransduction. Annu Rev Physiol. 2002;64:153–187. - PubMed
-
- Baker SA, Martemyanov KA, Shavkunov AS, Arshavsky VY. Kinetic mechanism of RGS9-1 potentiation by R9AP. Biochemistry. 2006;45:10690–10697. - PubMed
-
- Bauer PJ. Binding of the retinal rod Na+/Ca2+-K+ exchanger to the cGMP-gated channel indicates local Ca2+-signaling in vertebrate photoreceptors. Ann NY Acad Sci. 2002;976:325–334. - PubMed
Publication types
MeSH terms
Substances
Grants and funding
LinkOut - more resources
Full Text Sources
Other Literature Sources
Molecular Biology Databases