

Pittsburgh compound B (11C-PIB) and fluorodeoxyglucose (18 F-FDG) PET in patients with Alzheimer disease, mild cognitive impairment, and healthy controls
- PMID: 20430977
- PMCID: PMC3110668
- DOI: 10.1177/0891988710363715
Pittsburgh compound B (11C-PIB) and fluorodeoxyglucose (18 F-FDG) PET in patients with Alzheimer disease, mild cognitive impairment, and healthy controls
Abstract
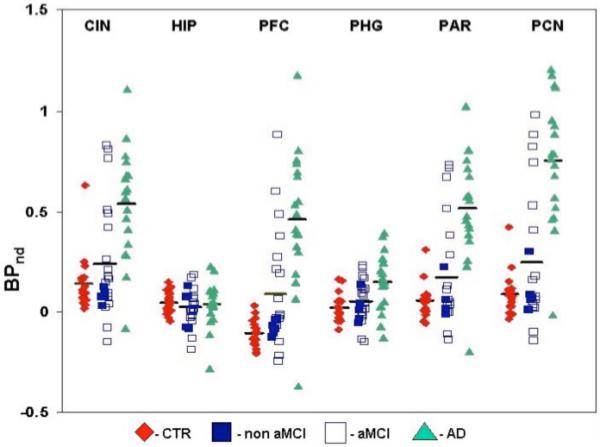
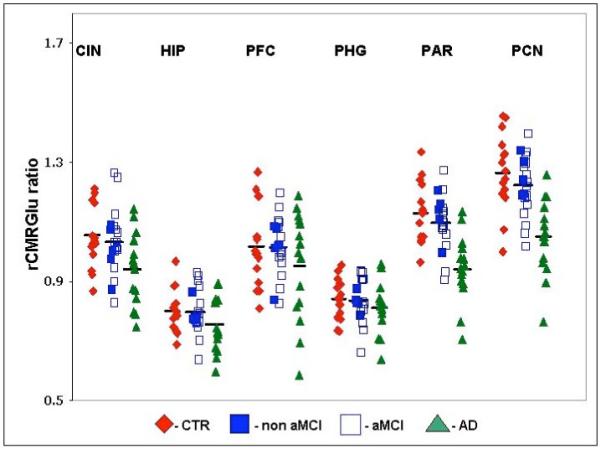
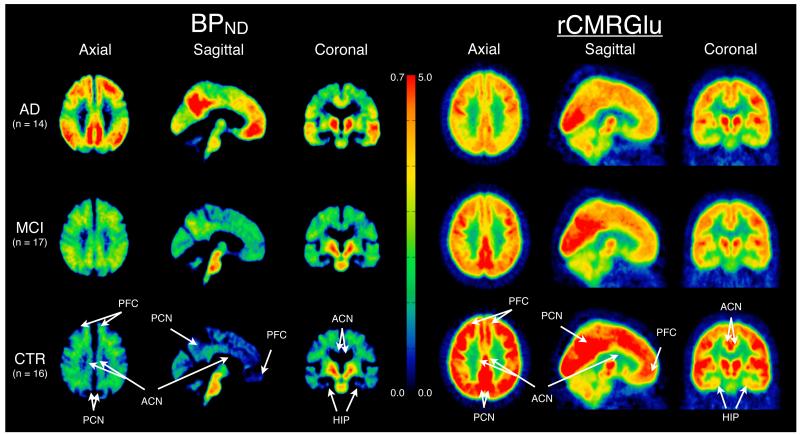
Amyloid load in the brain using Pittsburgh compound B ((11)C-PIB) positron emission tomography (PET) and cerebral glucose metabolism using fluorodeoxyglucose ((18)F-FDG) PET were evaluated in patients with mild Alzheimer disease (AD, n = 18), mild cognitive impairment (MCI, n = 24), and controls (CTR, n = 18). ( 11)C-PIB binding potential (BP(ND)) was higher in prefrontal cortex, cingulate, parietal cortex, and precuneus in AD compared to CTR or MCI and in prefrontal cortex for MCI compared to CTR. For (18)F-FDG, regional cerebral metabolic rate for glucose (rCMRGlu) was decreased in precuneus and parietal cortex in AD compared to CTR and MCI, with no MCI-CTR differences. For the AD-CTR comparison, precuneus BP(ND) area under the receiver operating characteristic (ROC) curve (AUC) was 0.938 and parietal cortex rCMRGlu AUC was 0.915; for the combination, AUC was 0.989. ( 11)C-PIB PET BP(ND) clearly distinguished diagnostic groups and combined with (18)F-FDG PET rCMRGlu, this effect was stronger. These PET techniques provide complementary information in strongly distinguishing diagnostic groups in cross-sectional comparisons that need testing in longitudinal studies.
Figures
References
-
- Miniño AM, Heron MP, Murphy SL, et al. Centers for Disease Control and Prevention National Center for Health Statistics National Vital Statistics System Deaths: final data for 2004. Natl Vital Stat Rep. 2007 Aug 21;55(19):1–119. - PubMed
-
- Knopman DS, DeKosky ST, Cummings JL, et al. Practice parameter: diagnosis of dementia (an evidence-based review). Report of the Quality Standards Subcommittee of the American Academy of Neurology. Neurology. 2001;56(9):1143–53. - PubMed
-
- Klunk WE, Engler H, Nordberg A, et al. Imaging brain amyloid in Alzheimer’s disease with Pittsburgh Compound-B. Ann Neurol. 2004 Mar;55(3):306–19. - PubMed
-
- Hyman BT, West HL, Rebeck GW, et al. Quantitative analysis of senile plaques in Alzheimer disease: observation of log-normal size distribution and molecular epidemiology of differences associated with apolipoprotein E genotype and trisomy 21 (Down syndrome) Proc Natl Acad Sci U S A. 1995 Apr 11;92(8):3586–90. - PMC - PubMed
-
- Price JL, Morris JC. Tangles and plaques in nondemented aging and “preclinical” Alzheimer’s disease. Ann Neurol. 1999;45:358–368. - PubMed
Publication types
MeSH terms
Substances
Grants and funding
LinkOut - more resources
Full Text Sources
Medical
