DNA methylation-related vitamin D receptor insensitivity in breast cancer
- PMID: 20431345
- PMCID: PMC3087945
- DOI: 10.4161/cbt.10.1.11994
DNA methylation-related vitamin D receptor insensitivity in breast cancer
Abstract
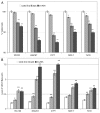
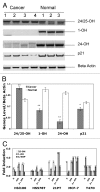
Calcitriol (1α, 25(OH)(2)-Vitamin D3) binds to the vitamin D receptor (VDR) and regulates differentiation of the normal mammary gland, and may therefore be useful in breast cancer treatment or prevention. Many breast cancer cells are, however, resistant to Calcitriol. In this study, we investigated the resistance mechanism and the role of epigenetic silencing of VDR by promoter hypermethylation. Bisulfite sequencing of the VDR promoter region revealed methylated CpG islands at -700 base pairs (bp) upstream and near the transcription start site. VDR CpG islands were demethylated by 5'deoxy-azacytidine treatment, and this was accompanied by a parallel increase in VDR mRNA levels in breast cancer cell lines. Quantitative methylation-specific PCR analyses confirmed hypermethylation of these CpG islands in primary tumors, and its absence in normal breast tissue. VDR transcripts detected in breast cancers were predominantly 5'-truncated, while normal breast tissue expressed full-length transcripts. Consistent with this observation, genes containing the VDR-responsive element (VDRE), such as cytochrome p450 hydroxylases, p21 or C/EBP were underexpressed in breast cancers compared to normal breast samples. Expression of the active longer transcripts of VDR was restored with 5'deoxy-Azacytidine (AZA) treatment, with a concurrent increase in expression of VDRE-containing genes. Thus, promoter methylation-mediated silencing of expression of the functional variants of VDR may contribute to reduced expression of downstream effectors of the VDR pathway and subsequent Calcitriol insensitivity in breast cancer. These data suggest that pharmacological reversal of VDR methylation may re-establish breast cancer cell susceptibility to differentiation therapy using Calcitriol.
Figures


Similar articles
-
Recruitment of NCOR1 to VDR target genes is enhanced in prostate cancer cells and associates with altered DNA methylation patterns.Carcinogenesis. 2013 Feb;34(2):248-56. doi: 10.1093/carcin/bgs331. Epub 2012 Oct 20. Carcinogenesis. 2013. PMID: 23087083 Free PMC article.
-
Resistance of HBL100 human breast epithelial cells to vitamin D action.Carcinogenesis. 1999 Apr;20(4):577-82. doi: 10.1093/carcin/20.4.577. Carcinogenesis. 1999. PMID: 10223184
-
Regulation of the human vitamin D3 receptor promoter in breast cancer cells is mediated through Sp1 sites.Mol Cell Endocrinol. 2005 Jan 31;230(1-2):59-68. doi: 10.1016/j.mce.2004.11.001. Mol Cell Endocrinol. 2005. PMID: 15664452
-
The vitamin D hormone and its nuclear receptor: molecular actions and disease states.J Endocrinol. 1997 Sep;154 Suppl:S57-73. J Endocrinol. 1997. PMID: 9379138 Review.
-
Genomic mechanisms involved in the pleiotropic actions of 1,25-dihydroxyvitamin D3.Biochem J. 1996 Jun 1;316 ( Pt 2)(Pt 2):361-71. doi: 10.1042/bj3160361. Biochem J. 1996. PMID: 8687373 Free PMC article. Review.
Cited by
-
Vitamin D and cancer: a review of molecular mechanisms.Biochem J. 2012 Jan 1;441(1):61-76. doi: 10.1042/BJ20110744. Biochem J. 2012. PMID: 22168439 Free PMC article. Review.
-
Differential response to 1α,25-dihydroxyvitamin D3 (1α,25(OH)2D3) in non-small cell lung cancer cells with distinct oncogene mutations.J Steroid Biochem Mol Biol. 2013 Jul;136:264-70. doi: 10.1016/j.jsbmb.2012.09.022. Epub 2012 Sep 28. J Steroid Biochem Mol Biol. 2013. PMID: 23026510 Free PMC article. Review.
-
Methylation of the Vitamin D Receptor (VDR) Gene, Together with Genetic Variation, Race, and Environment Influence the Signaling Efficacy of the Toll-Like Receptor 2/1-VDR Pathway.Front Immunol. 2017 Sep 11;8:1048. doi: 10.3389/fimmu.2017.01048. eCollection 2017. Front Immunol. 2017. PMID: 28959253 Free PMC article.
-
Increased copy-number and not DNA hypomethylation causes overexpression of the candidate proto-oncogene CYP24A1 in colorectal cancer.Int J Cancer. 2013 Sep 15;133(6):1380-8. doi: 10.1002/ijc.28143. Epub 2013 Apr 5. Int J Cancer. 2013. PMID: 23463632 Free PMC article.
-
Vitamin D May Protect against Breast Cancer through the Regulation of Long Noncoding RNAs by VDR Signaling.Int J Mol Sci. 2022 Mar 16;23(6):3189. doi: 10.3390/ijms23063189. Int J Mol Sci. 2022. PMID: 35328609 Free PMC article. Review.
References
-
- Raimondi S, Johanson H, Maisonneuve P, Gandini S. Review and meta-analysis on Vitamin D Receptor polymorphisms and cancer risk. Carcinogenesis. 2009 - PubMed
-
- Colston KW, Hansen CM. Mechanisms implicated in the growth regulatory effects of vitamin D in breast cancer. Endocr Relat Cancer. 2002;9:45–59. - PubMed
-
- Qi X, Pramanik R, Wang J, Schultz RM, Maitra RK, Han J, et al. The p38 and JNK pathways cooperate to trans-activate vitamin D receptor via c-Jun/AP-1 and sensitize human breast cancer cells to vitamin D(3)-induced growth inhibition. J Biol Chem. 2002;277:25884–25892. - PubMed
-
- Zinser G, Packman K, Welsh J. Vitamin D(3) receptor ablation alters mammary gland morphogenesis. Development. 2002;129:3067–3076. - PubMed
-
- Colston K, Colston MJ, Feldman D. 1,25-dihydroxyvitamin D3 and malignant melanoma: the presence of receptors and inhibition of cell growth in culture. Endocrinology. 1981;108:1083–1086. - PubMed
Publication types
MeSH terms
Substances
Grants and funding
LinkOut - more resources
Full Text Sources
Other Literature Sources
Medical
