. 2010 Oct;17(10):1645-54.
doi: 10.1038/cdd.2010.44. Epub 2010 Apr 30.

Smac mimetics increase cancer cell response to chemotherapeutics in a TNF-α-dependent manner

Affiliations

Smac mimetics increase cancer cell response to chemotherapeutics in a TNF-α-dependent manner

B L Probst et al. Cell Death Differ. 2010 Oct.

Abstract

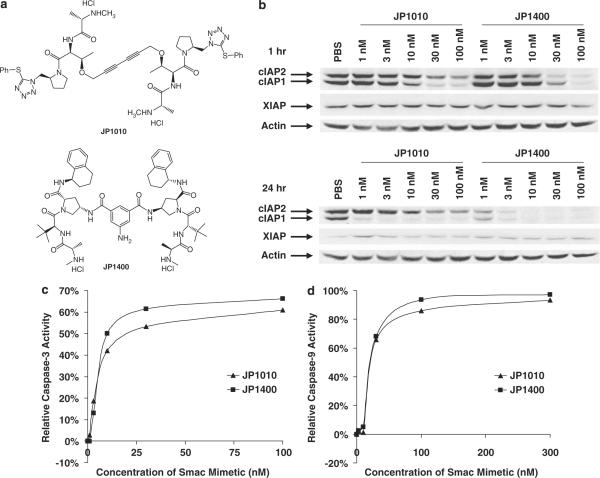
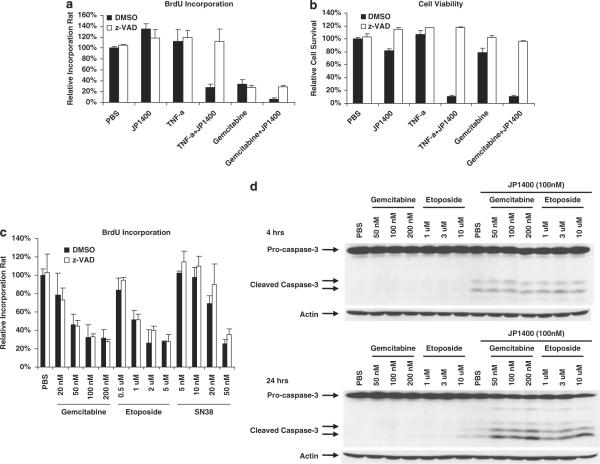
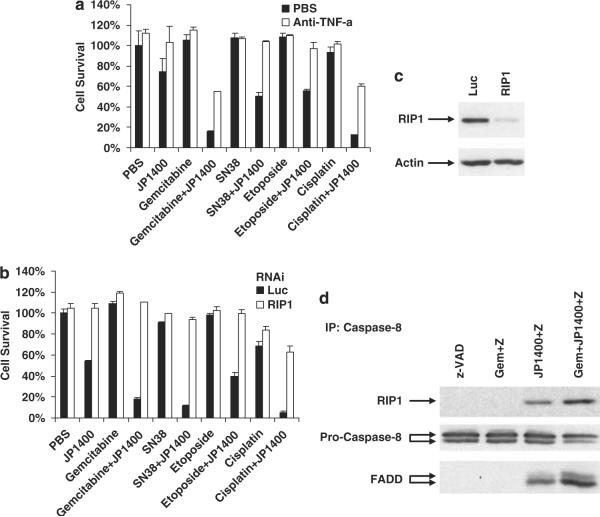
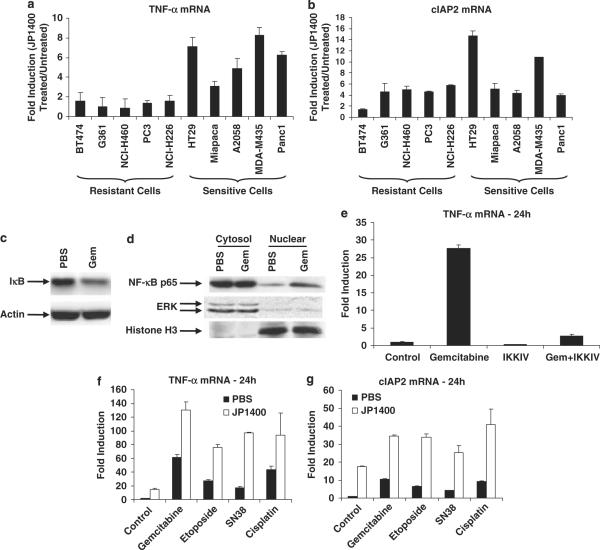
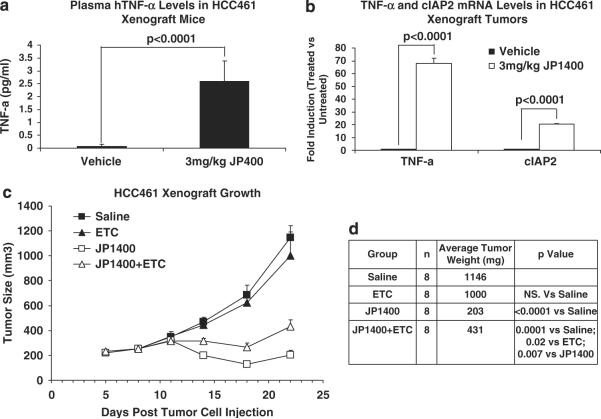
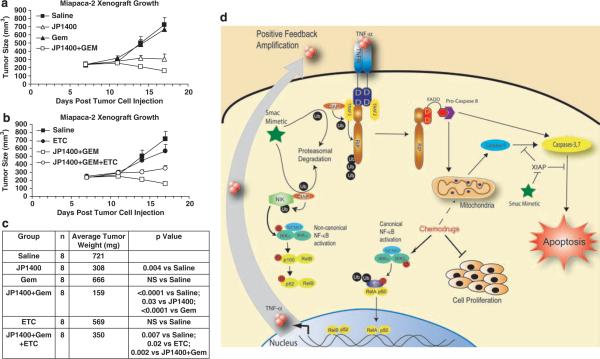
Second mitochondria-derived activator of caspase (Smac) is a mitochondrial protein released into the cytosol during apoptosis. Smac mimetics have recently been touted as a novel therapeutic to induce apoptosis in cancer cells. The ability of Smac mimetics to induce apoptosis in vitro has been shown to be dependent upon both XIAP neutralization and cancer cell autocrine tumor necrosis factor-α (TNF-α) production. In this study we provide new evidence for the utility of Smac mimetics in combination with conventional chemotherapy agents to exacerbate caspase activation and induce cancer cell death. Furthermore, we find that the combination effect is because of a multifaceted mechanism involving both inhibition of cell proliferation by the chemotherapy agents and an enhanced autocrine TNF-α feedback loop by the Smac mimetic/chemotherapy agent combination. Surprisingly, although genotoxic agents typically induce apoptosis through the mitochondrial intrinsic pathway, we show that this synergism is mediated through a TNF-α/RIP1-dependent pathway, leading to activation of the extrinsic apoptotic pathway. Finally, we report that autocrine TNF-α contributes to Smac mimetic-induced tumor regression as a single agent or in combination with chemotherapeutics in xenograft mouse models. Collectively, we provide mechanistic and applicable data to support translational studies in the use of a Smac mimetic/chemotherapy antineoplasm modality.


Figures

Figure 1
Figure 1
Comparison of JP1010 with JP1400 in cIAP and XIAP activities. (a) Chemical structures of JP1010 and JP1400. (b) Panc-1 cells were treated with increasing concentration of JP1010 or JP1400 for 1 or 24 h. The levels of cIAP1, cIAP2 and XIAP were determined by western blot analysis. (c) Caspase-3 de-repression assay and (d) caspase-9 de-repression assay were carried out as described in the Materials and Methods. Experiments were repeated three times with similar results
Figure 2
Figure 2
Chemotherapeutics, not JP1400, inhibit cell proliferation. (a) A2058 cells were treated with 100 nM JP1400, 100 nM gemcitabine and/or 100 ng/ml TNF-α for 24 h in the presence or absence of 20 μM z-VAD. Cells were then labeled with BrdU as described in the Materials and Methods. Cell proliferation rate was normalized with that of control samples. (b) A2058 cells were treated as in a for 48 h. Cell viability was determined by measuring ATP levels. (c) A2058 cells were treated with chemotherapy agents at the indicated concentration for 24 h in the presence or absence of 20 μM z-VAD. Cell proliferation rate was determined same as a. Data are presented as mean+S.D. of triplicates. All experiments were repeated three times with similar results. (d) A2058 cells were treated with JP1400 and/or chemotherapy agents at the indicated concentration. Cell lysates were collected after 4 or 24 h. Caspase-3 and actin levels were determined by western blot analysis. Results are representative of two independent experiments
Figure 3
Figure 3
Chemotherapy agent/Smac mimetic synergism acts through autocrine TNF-α/RIP1-dependent pathway. (a) A2058 cells were pretreated with PBS or 5 μg/ml TNF-α-neutralizing antibody for 2 h, and then treated with gemcitabine (100 nM), SN38 (50 nM), etoposide (1 μM) or cisplatin (10 μM) with or without 100 nM JP1400 for 48 h. Cell viability was determined by measuring ATP levels. Data are presented as mean+S.D. of triplicates. (b) A2058 cells were transfected with control luciferase (Luc) siRNA or RIP1 siRNA for 48 h. Cells were then treated with gemcitabine (100 nM), SN38 (50 nM), etoposide (1 μM) or cisplatin (10 μM) with or without 100 nM JP1400 for 48 h. Cell viability was determined by measuring ATP levels. Data are presented as mean+S.D. of triplicates. (c) Cell lysates were collected 48 h after transfection and were subjected to western blot analysis of RIP1 and actin levels. (d) A2058 cells were treated with 100 nM gemcitabine and/or 100 nM JP1400 in the presence of 20 μM z-VAD for 24 h. Cells were collected and caspase-8 immunoprecipitation was carried out as described in Materials and Methods. The levels of RIP1, caspase-8 and FADD in the immunocomplex were determined by western blot analysis. All experiments were repeated at least two times with similar results
Figure 4
Figure 4
Induction of TNF-α mRNA levels in response to JP1400 correlates with sensitivity to JP1400/chemotherapy agent combinations. (a, b) Cancer cells were treated with 100 nM JP1400 for 4 h. Total RNA was extracted and analyzed for TNF-α (a) and cIAP2 (b) expression by real-time PCR. Sample data were normalized to cyclophilin levels and are expressed as fold induction of JP1400-treated cells over untreated cells. Results shown are the average of triplicate measurements+S.D. and are representative of at least two independent experiments. (c) A2058 cells were treated with PBS or 200 nM gemcitabine for 24 h. IκB-α and actin levels were determined by western blot analysis. (d) A2058 cells were treated with PBS or 200 nM gemcitabine for 24 h. Nuclear and cytosolic fractions were generated as described in Materials and Methods. NF-κB p65, ERK and Histone H3 levels were determined by western blot analysis. (e) A2058 cells were pretreated with PBS or 1 μM IKK IV inhibitor for 1 h, and then treated with or without 200 nM gemcitabine for 24 h. Total RNA was extracted and analyzed for TNF-α expression by real-time PCR. Sample data were normalized to cyclophilin levels and are expressed as fold induction over untreated cells. Results shown are the average of triplicate measurements+S.D. and are representative of at least two independent experiments. (f, g) A2058 cells were treated with 200 nM gemcitabine, 3 μM etoposide, 20 nM SN38 or 30 μM cisplatin etoposide, 20 nM SN38 or 30 μM cisplatin in the presence of PBS or 100 nM JP1400 in the presence of 20 μM z-VAD for 24 h. Total RNA was extracted and analyzed for TNF-α (f) or cIAP2 (g) expression by real-time PCR. Sample data were normalized to cyclophilin levels and are expressed as fold induction of treated over untreated cells. Data are presented as mean+S.D. of three independent experiments
Figure 5
Figure 5
Autocrine TNF-α contributes to JP1400-induced tumor regression in HCC461 xenograft model. (a, b) HCC461 xenograft mice were i.v. injected with either saline (n=5) or 3 mg/kg JP1400 (n=5). At 6 h after treatment, mice were killed and blood and tumor samples were collected. (a) hTNF-α levels were measured in the plasma using ELISA. (b) Total RNA was extracted from HCC461 tumor samples and analyzed for TNF-α and cIAP2 expression by real-time PCR. Sample data were normalized to cyclophilin levels and are expressed as fold induction of JP1400-treated over vehicle-treated samples. Data are presented as mean+S.D. (c, d) HCC461 xenograft mice were treated with 5 mg/kg of ETC (etanercept) or vehicle (saline) i.p. at days 6, 8, 11, 13 and 15 after tumor inoculation. JP1400 or vehicle (saline), 1 mg/kg, was i.v. administrated on day 13. Tumor growth curve was shown in c as mean+S.E.M. and tumor weight at day 22 is shown in d
Figure 6
Figure 6
Gemcitabine/JP1400 combination effect in Miapaca-2 xenograft model is partially blocked by etanercept. (a–c) Miapaca-2 tumor-bearing mice were treated with 1 mg/kg of GEM or vehicle (saline) i.p. every day for 6 days, starting from day 10 after tumor inoculation. JP1400 or vehicle (saline), 3 mg/kg, was i.v. administered every other day for three times, starting from day 11 after tumor inoculation. ETC or vehicle (saline), 5 mg/kg, was i.p. given every other day for five times, starting from day 7 after tumor inoculation. Tumor growth curve was shown in a and b as mean+S.E.M. and tumor weight at day 22 was shown in c. (d) Model of synergism between Smac mimetic and chemotherapy agents

References

    1. Gorlick R, Bertino J. Drug Resistance in colon cancer. Semin Oncol. 1999;26:606–611. - PubMed
    1. Weinstein IB. Cancer. Addiction to oncogenes–the Achilles heal of cancer. Science. 2002;297:63–64. - PubMed
    1. Fesik SW. Promoting apoptosis as a strategy for cancer drug discovery. Nat Rev Cancer. 2005;5:876–885. - PubMed
    1. Los M, Burek CJ, Stroh C, Benedyk K, Hug H, Mackiewicz A. Anticancer drugs of tomorrow: apoptotic pathways as targets for drug design. Drug Discov Today. 2003;8:67–77. - PubMed
    1. Du C, Fang M, Li Y, Li L, Wang X. Smac, a mitochondrial protein that promotes cytochrome c-dependent caspase activation by eliminating IAP inhibition. Cell. 2000;102:33–42. - PubMed

Publication types

MeSH terms