

fMR-Adaptation Reveals Invariant Coding of Biological Motion on the Human STS
- PMID: 20431723
- PMCID: PMC2861476
- DOI: 10.3389/neuro.09.015.2010
fMR-Adaptation Reveals Invariant Coding of Biological Motion on the Human STS
Abstract
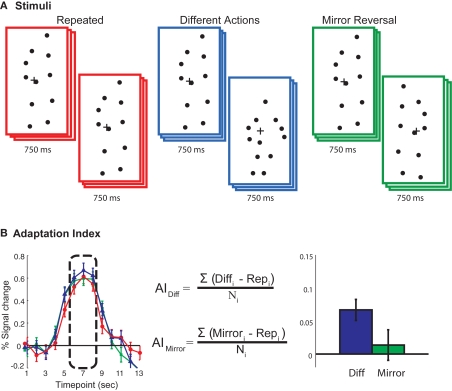
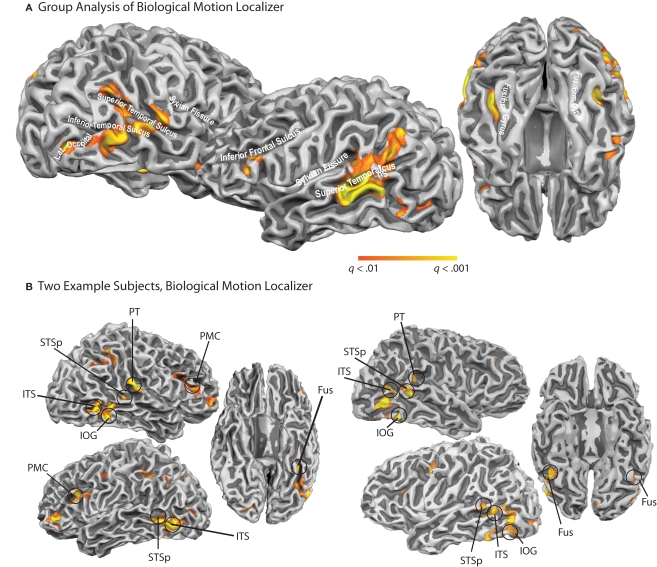
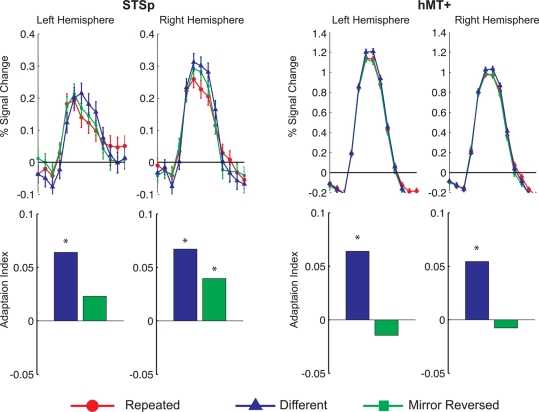
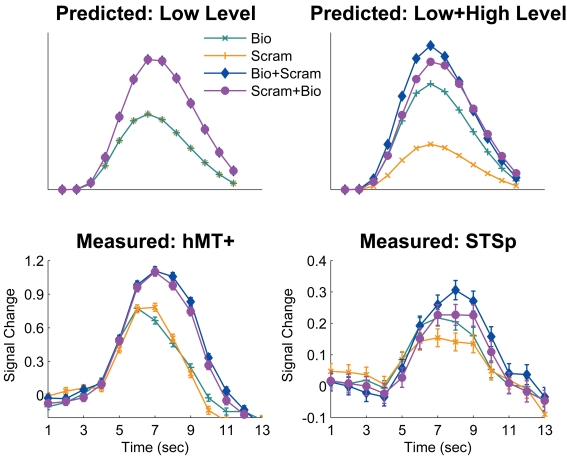
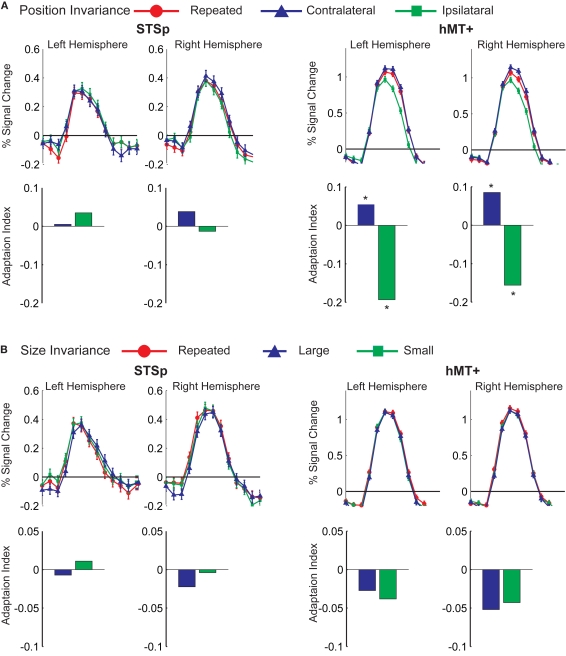
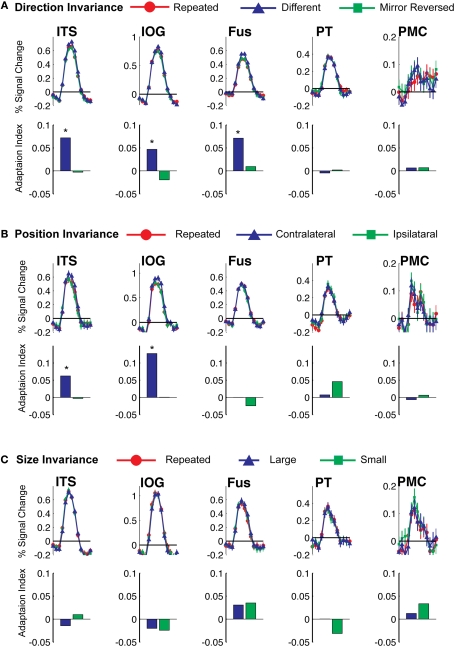
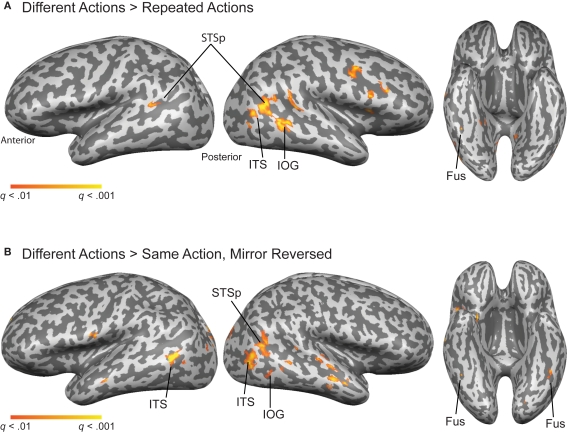
Neuroimaging studies of biological motion perception have found a network of coordinated brain areas, the hub of which appears to be the human posterior superior temporal sulcus (STSp). Understanding the functional role of the STSp requires characterizing the response tuning of neuronal populations underlying the BOLD response. Thus far our understanding of these response properties comes from single-unit studies of the monkey anterior STS, which has individual neurons tuned to body actions, with a small population invariant to changes in viewpoint, position and size of the action being viewed. To measure for homologous functional properties on the human STS, we used fMR-adaptation to investigate action, position and size invariance. Observers viewed pairs of point-light animations depicting human actions that were either identical, differed in the action depicted, locally scrambled, or differed in the viewing perspective, the position or the size. While extrastriate hMT+ had neural signals indicative of viewpoint specificity, the human STS adapted for all of these changes, as compared to viewing two different actions. Similar findings were observed in more posterior brain areas also implicated in action recognition. Our findings are evidence for viewpoint invariance in the human STS and related brain areas, with the implication that actions are abstracted into object-centered representations during visual analysis.
Keywords: biological motion; fMRI; superior temporal sulcus; vision; visual recognition.
Figures
Similar articles
-
Position and Identity Information Available in fMRI Patterns of Activity in Human Visual Cortex.J Neurosci. 2015 Aug 19;35(33):11559-71. doi: 10.1523/JNEUROSCI.0752-15.2015. J Neurosci. 2015. PMID: 26290233 Free PMC article.
-
Brain activity evoked by inverted and imagined biological motion.Vision Res. 2001;41(10-11):1475-82. doi: 10.1016/s0042-6989(00)00317-5. Vision Res. 2001. PMID: 11322987
-
Perception of biological motion in schizophrenia and healthy individuals: a behavioral and FMRI study.PLoS One. 2011;6(5):e19971. doi: 10.1371/journal.pone.0019971. Epub 2011 May 20. PLoS One. 2011. PMID: 21625492 Free PMC article.
-
Orientation Encoding and Viewpoint Invariance in Face Recognition: Inferring Neural Properties from Large-Scale Signals.Neuroscientist. 2018 Dec;24(6):582-608. doi: 10.1177/1073858418769554. Epub 2018 Jun 1. Neuroscientist. 2018. PMID: 29855217 Review.
-
Learning Invariant Object and Spatial View Representations in the Brain Using Slow Unsupervised Learning.Front Comput Neurosci. 2021 Jul 21;15:686239. doi: 10.3389/fncom.2021.686239. eCollection 2021. Front Comput Neurosci. 2021. PMID: 34366818 Free PMC article. Review.
Cited by
-
Emotional Actions Are Coded via Two Mechanisms: With and without Identity Representation.Front Psychol. 2016 May 11;7:693. doi: 10.3389/fpsyg.2016.00693. eCollection 2016. Front Psychol. 2016. PMID: 27242606 Free PMC article.
-
How the Human Brain Represents Perceived Dangerousness or "Predacity" of Animals.J Neurosci. 2016 May 11;36(19):5373-84. doi: 10.1523/JNEUROSCI.3395-15.2016. J Neurosci. 2016. PMID: 27170133 Free PMC article.
-
Spontaneous resting-state BOLD fluctuations reveal persistent domain-specific neural networks.Soc Cogn Affect Neurosci. 2012 Apr;7(4):467-75. doi: 10.1093/scan/nsr018. Epub 2011 May 17. Soc Cogn Affect Neurosci. 2012. PMID: 21586527 Free PMC article.
-
Invariant recognition drives neural representations of action sequences.PLoS Comput Biol. 2017 Dec 18;13(12):e1005859. doi: 10.1371/journal.pcbi.1005859. eCollection 2017 Dec. PLoS Comput Biol. 2017. PMID: 29253864 Free PMC article.
-
Concept Representation Reflects Multimodal Abstraction: A Framework for Embodied Semantics.Cereb Cortex. 2016 May;26(5):2018-34. doi: 10.1093/cercor/bhv020. Epub 2015 Mar 5. Cereb Cortex. 2016. PMID: 25750259 Free PMC article.