Comparative Study
. 2010 May;63(5):1305-14.
doi: 10.1002/mrm.22338.

Dynamic susceptibility contrast MRI with localized arterial input functions

Affiliations
Comparative Study

Dynamic susceptibility contrast MRI with localized arterial input functions

John J Lee et al. Magn Reson Med. 2010 May.

Abstract

Compared to gold-standard measurements of cerebral perfusion with positron emission tomography using H(2)[(15)O] tracers, measurements with dynamic susceptibility contrast MR are more accessible, less expensive, and less invasive. However, existing methods for analyzing and interpreting data from dynamic susceptibility contrast MR have characteristic disadvantages that include sensitivity to incorrectly modeled delay and dispersion in a single, global arterial input function. We describe a model of tissue microcirculation derived from tracer kinetics that estimates for each voxel a unique, localized arterial input function. Parameters of the model were estimated using Bayesian probability theory and Markov-chain Monte Carlo, circumventing difficulties arising from numerical deconvolution. Applying the new method to imaging studies from a cohort of 14 patients with chronic, atherosclerotic, occlusive disease showed strong correlations between perfusion measured by dynamic susceptibility contrast MR with localized arterial input function and perfusion measured by quantitative positron emission tomography with H(2)[(15)O]. Regression to positron emission tomography measurements enabled conversion of dynamic susceptibility contrast MR to a physiologic scale. Regression analysis for localized arterial input function gave estimates of a scaling factor for quantitation that described perfusion accurately in patients with substantial variability in hemodynamic impairment.


Figures

Fig. 1
Fig. 1
Plots describe the parameter estimation phase of Bayesian processing for a single voxel. Parameter estimates were produced by sampling the Markov chain for the data model. (a) The observed magnetization vs. time in the selected voxel is plotted in red. Superposed in black is the model generated from parameters that maximized the joint posterior probability. The difference curve is plotted in green. Histograms of samples of the parameters (b) t0, (c) α, (d) β and (e) CBF display estimated probabilities along the vertical axes. Scatter plots of parameter pairs (f) t0 versus α; (g) t0 versus CBF; (h) α versus β; (i) α versus CBF; further details in Results.
Fig. 2
Fig. 2
T1-weighted MR study and maps of hemodynamic parameters from the LAIF method for a patient with a history of lacunar infarcts and cerebral vascular accident involving the right middle-cerebral artery. CBF, CBV and MTT were estimated with LAIF. Additional tracer-kinetic parameters uniquely provided by LAIF are: α, which characterizes the rapidity of inflow of contrast agent in the AIF; β, which characterizes the rate of outflow of contrast agent in the AIF; t0, the time of arrival of the contrast agent tracer during its first passage through the cerebral circulation; and c1, the relative weight of the concentration of the first-passage of contrast agent to the time-integral of concentration.
Fig. 3
Fig. 3
CBF maps from MR LAIF and PET for three representative patients. Column (a) shows anatomical references. Columns (b—d) show CBF maps with native spatial resolutions for MR and PET. Columns (e—g) show results of block averaging to 10 × 10 × 6 mm2, used to match differing spatial resolutions.
Fig. 4
Fig. 4
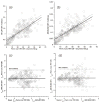
Analysis of correlations between PET CBF and MR CBF for a representative patient (patient 1). Plotted points are block-averages of parenchyma voxels only. Blocks containing a majority of CSF or artery-rich voxels are excluded. (a) Scatter plot of PET CBF vs. MR LAIF CBF. Linear regression yielded: CBFLAIF = −0.464 + 0.0326 CBFPET, which is plotted as a bold line. The 95% confidence interval for the fitted line with non-simultaneous is plotted with dashed lines. The squared Pearson product-moment correlation coefficient is 0.493. (b) Similar plot of PET CBF vs. MR MLEM CBF. Regression yielded: CBFMLEM = 0.0521+ 0.00282 CBFPET. The squared correlation coefficient is 0.446. For Bland-Altman analysis of systematic trends the standardized first-moment of CBF values was used: fμσ. (c) Differences between first-moments of MR LAIF CBF and matching PET CBF are plotted with respect to the unbiased estimate of the true first-moment of CBF, the average of first moments of MR LAIF CBF and matching PET CBF. The 95% confidence intervals for differences are ±1.51. (d) The difference between first moments of MR MLEM CBF and matching PET CBF is plotted against the unbiased estimate. The 95% confidence intervals for differences are ±1.60.
Fig. 5
Fig. 5
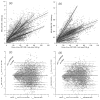
The analysis of correlations described in Fig. 4 was applied to pooled PET and MR measurement from fourteen patients. Plotted points are block-averages of parenchyma voxels with each patient assigned a unique grey-value. (a) Scatter plot of PET CBF vs. MR LAIF CBF. For each patient, linear regression results are listed in Table 1; for each patient, regression and 95% confidence intervals are plotted with bold and dashed lines respectively. Linear regression over pooled data from all 14 patients yielded: CBFLAIF = 1.03 + 0.0483 CBFPET, which is not plotted. The squared correlation coefficient is 0.314. (b) Plot of PET CBF vs. MR MLEM CBF. For each patient linear regression results are listed in Table 1. Pooled regression yielded: CBFMLEM = 0.155 + 0.00546 CBFPET, which is not plotted. The squared correlation coefficient is 0.246. (c) Bland-Altman analyses of the differences between the first moments of MR LAIF CBF and matched PET CBF vs. the unbiased estimate of the true first-moment of CBF, the average of first moments of MR LAIF CBF and matching PET CBF. For each patient, 95% confidence intervals are plotted with dashed lines. Ninety-five percent confidence intervals for pooled mean differences from all 14 patients are ±1.69, which is not shown. (d) Bland-Altman analyses of the differences between the first moments of MR MLEM CBF and matched PET CBF vs. the unbiased estimate of the true first-moment of CBF. Ninety-five percent confidence intervals for pooled mean differences are ±1.59.

References

    1. Grubb RL, Jr, Derdeyn CP, Fritsch SM, Carpenter DA, Yundt KD, Videen TO, Spitznagel EL, Powers WJ. Importance of hemodynamic factors in the prognosis of symptomatic carotid occlusion. JAMA. 1998;280(12):1055–1060. - PubMed
    1. Gonzalez RG. Acute ischemic stroke : imaging and intervention. Berlin: Springer; 2005. p. xii.p. 268.
    1. Zazulia AR, Markham J, Powers WJ. Cerebral blood flow and metabolism in human cerebrovascular disease. In: Mohr JP, editor. Stroke: Pathophysiology, Diagnosis, and Management. Churchill and Livingstone; 2004.
    1. Powers WJ, Raichle ME, Grubb RL., Jr Positron emission tomography to assess cerebral perfusion. Lancet. 1985;1(8420):102–103. - PubMed
    1. Powers WJ, Zazulia AR. The use of Positron Emission Tomography in cerebrovascular disease. Neuroimag Clin N Am. 2003;13:741–758. - PubMed

Publication types

MeSH terms