. 2010 May 28;32(5):692-702.
doi: 10.1016/j.immuni.2010.04.010. Epub 2010 Apr 29.

Toll-like receptor 2 signaling in CD4(+) T lymphocytes promotes T helper 17 responses and regulates the pathogenesis of autoimmune disease

Affiliations

Toll-like receptor 2 signaling in CD4(+) T lymphocytes promotes T helper 17 responses and regulates the pathogenesis of autoimmune disease

Joseph M Reynolds et al. Immunity. .

Abstract

Toll-like receptors (TLRs) have previously been shown to play critical roles in the activation of innate immunity. Here, we describe that T cell expression of TLR2 regulates T helper 17 (Th17) cell responses. Stimulation with TLR2 agonists promoted Th17 differentiation in vitro and led to more robust proliferation and Th17 cytokine production. Using the experimental autoimmune encephalomyelitis (EAE) model, we found that TLR2 regulated Th17 cell-mediated autoimmunity in vivo and that loss of TLR2 in CD4(+) T cells dramatically ameliorated EAE. This study thus reveals a critical role of a TLR in the direct regulation of adaptive immune response and pathogenesis of autoimmune diseases.


Figures

Figure 1
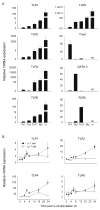
Figure 1. TLR expression in Th17 cells
(a) Expression of various TLRs on Th1, Th2, and Th17 cells following 4-day differentiation. Bone marrow-derived macrophages and IL-17-producing γδ T cells were utilized as positive controls. Relative mRNA expression was compared by setting the lowest expression amount to an arbitrary value of 1. (b) Expression of TLRs on αβ and γδ T cells following IL-23 timepoint stimulation. 20 ng/ml IL-23 was added to sorted splenic CD4+ and γδ T lymphocytes and cells were lysed at 0, 2, 4, 6, 8, 16, and 24 hrs post IL-23 stimulation. Unstimulated cells served as the expression baseline. For all experiments, data are presented as mean + SD and are a representative of at least two independent experiments. All gene quantities were normalized to the expression of the reference gene β-actin.
Figure 2
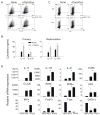
Figure 2. Enhanced Th17 differentiation following TLR2 activation
(a) Intracellular cytokine staining following four-day Th17 differentiation in the absence (left) or presence (right) of Pam3Cys. Each panel represents cells derived from an individual mouse, 2 mice were used for each treatment group. (b) ELISA analysis of supernatants from primary four-day differentiation (left) or overnight anti-CD3 only restimulated (right) cultures. All groups are analyzed in triplicate and are presented here as the mean + SD from three individual mice per group. (c) Th17 differentiation was performed as in (a) using naïve T cells derived from WT and Tlr2−/− animals. (d) mRNA expression of naïve and Th17 cells differentiated in the absence or presence of Pam3Cys. Each bar represents mean + SD values obtained from T cells of three individual mice. Naïve T cell gene expression was used as the baseline of expression and all gene quantities were normalized to the expression of β-actin. * = Students t test; p < 0.05. All data are a representative of at least three individual experiments.
Figure 3
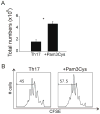
Figure 3. Proliferation of Th17 cells following TLR2 engagement
(a) Assessment of total cell numbers following Th17 differentiation in the presence or absence of Pam3Cys. Each bar represents T cells derived from 2 individual mice. * = Students t test; p < 0.05. (b) CFSE staining of Th17 cells following 4 days of differentiation in the absence (left) or presence (right) of Pam3Cys. Numbers shown in each gate are indicative of mean fluorescent intensity. Data are a representative of four independent experiments.
Figure 4
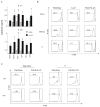
Figure 4. The effect of TLR2 activation in combination with IL-23 on αβ and γδ T cells
(a) Overnight anti-CD3 activation of Th17 cells with various TLR ligands following 4-day differentiation. The production of IL-17 (top) and IL-22 (bottom) was assessed in triplicate by ELISA. * = Students t test, p < 0.05. * = significant comparison of samples without IL-23 to untreated control. ** = significant comparison of samples treated with IL-23 to untreated IL-23 samples and untreated controls. (b) CFSE labeling of sorted naïve CD4+, memory CD4+, and γδ T cells following 2-day stimulation with TLR2 agonist or IL-23. Data are representative of three individual experiments. (c) CFSE labeling of sorted total CD4+ T cells (left) and γδ T cells (right) derived from WT (top) and Tlr2−/− (bottom) animals. Data are a representative of three independent experiments. Numbers shown in each gate are indicative of mean fluorescent intensity.
Figure 5
Figure 5. Analysis of WT, Tlr2−/−, and Il23a−/− γδ cells
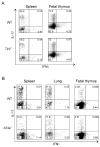
(a) Splenic (left) or embryonic (right) γδ T cells derived from WT (top) or Tlr2−/− (bottom) thymus were stimulated with PMA plus ionomycin for five hours and stained for IL-17 and IFNγ production. Embryos were harvested from timed breeders following day 18.5 post vaginal plug observation. (b) IL-17 production was investigated in γδ T cells derived from WT or Il23a−/− spleens (left), lungs (center), and fetal thymi (right). Data presented is representative of multiple experiments. γδ T cells were isolated and intracellular cytokine staining was assessed following five-hour PMA plus ionomycin stimulation. Data are a representative of at least two experiments, using at least two mice per group.
Figure 6
Figure 6. Assessment of EAE in Tlr2−/− bone marrow-reconstituted mice
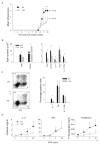
(a) Clinical score data comparing EAE mice reconstituted with WT or TLR2-deficient bone marrow. Data are representative of 3 individual experiments, n = 3–5 mice per group per experiment. (b) CNS infiltration analysis of the bone marrow-reconstituted mice presented in (a). Total infiltrating CNS and splenic cell counts are presented in the left panel. Analysis of CNS-infiltrating CD4+, CD11b+, IL-17+, and IFNγ+ are presented in the right panel following five-hour PMA plus ionomycin restimulation. (c) Representative CNS intracellular cytokine staining of WT and Tlr2−/− bone marrow-reconstituted mice following five-hour PMA plus ionomycin restimulation (left). The right panel is a comparison of the percentage of cytokine-positive cells of all the mice analyzed, n = 5 per group. (d) Splenic MOG recall assays. Splenocytes derived from each group were restimulated with MOG peptide for three days and cytokine production was assessed by ELISA (left and center). Proliferation was examined following three-day MOG restimulation and an eight-hour 3H-thymidine pulse (right). Data are presented as mean + SD for triplicate determinations. * = Students t test; p < 0.05.
Figure 7
Figure 7. Assessment of EAE development and Th17 differentiation by Tlr2−/− CD4+ T cells
(a) Clinical scores of EAE mice that were transferred with WT or Tlr2−/− CD4+ T cells. Data are a representative of two individual experiments with five mice utilized per group. (b) Examination of CNS infiltration following EAE induction. The top panel represents total cell infiltration, where the bottom panel represents the total numbers of cytokine-positive cells following five-hour PMA plus ionomycin reactivation. (c) mRNA analysis of CNS tissues at day 17 following EAE initiation. Three mice per group were analyzed at day 17 and gene expression was normalized to the expression of the reference gene β-actin. (d) Rag1-deficient mice were reconstituted with CD4+ T cells derived from C57BL/6 (WT) or TLR2-deficient mice. Clinical scores were monitored daily following EAE induction with LPS emulsified in IFA and MOG. Fractions on the right represent mice developing EAE out of total mice analyzed. (e) IL-17- and IFNγ-positive cells in the draining lymph nodes of Rag1−/− mice transferred with WT or Tlr2−/− CD4+ T cells following seven day KLH immunization and three day KLH reactivation. (f) IL-17 and IFNγ cytokine production was measured by ELISA in bone marrow chimeric mice following seven day KLH immunization. CD45.1 (WT) versus CD45.2 (Tlr2−/−) CD4+ T cells were sorted and cultured with irradiated WT splenocytes and 50μg/ml KLH for 3 days prior to cytokine assessment. * = Students t test; p < 0.05. Data are a representative of at least two individual experiments.

References

    1. Blink SE, Miller SD. The contribution of gammadelta T cells to the pathogenesis of EAE and MS. Curr Mol Med. 2009;9:15–22. - PMC - PubMed
    1. Brustle A, Heink S, Huber M, Rosenplanter C, Stadelmann C, Yu P, Arpaia E, Mak TW, Kamradt T, Lohoff M. The development of inflammatory T(H)-17 cells requires interferon-regulatory factor 4. Nat Immunol. 2007;8:958–966. - PubMed
    1. Chen Q, Davidson TS, Huter EN, Shevach EM. Engagement of TLR2 does not reverse the suppressor function of mouse regulatory T cells, but promotes their survival. J Immunol. 2009;183:4458–4466. - PMC - PubMed
    1. Chung Y, Chang SH, Martinez GJ, Yang XO, Nurieva R, Kang HS, Ma L, Watowich SS, Jetten AM, Tian Q, Dong C. Critical regulation of early Th17 cell differentiation by interleukin-1 signaling. Immunity. 2009;30:576–587. - PMC - PubMed
    1. Cottalorda A, Verschelde C, Marcais A, Tomkowiak M, Musette P, Uematsu S, Akira S, Marvel J, Bonnefoy-Berard N. TLR2 engagement on CD8 T cells lowers the threshold for optimal antigen-induced T cell activation. Eur J Immunol. 2006;36:1684–1693. - PubMed

Publication types

MeSH terms