Review
. 2010 Jun;4(3):255-66.
doi: 10.1016/j.molonc.2010.04.001. Epub 2010 Apr 9.

Genomic instability in breast cancer: pathogenesis and clinical implications

Affiliations
Review

Genomic instability in breast cancer: pathogenesis and clinical implications

Kevin A Kwei et al. Mol Oncol. 2010 Jun.

Abstract

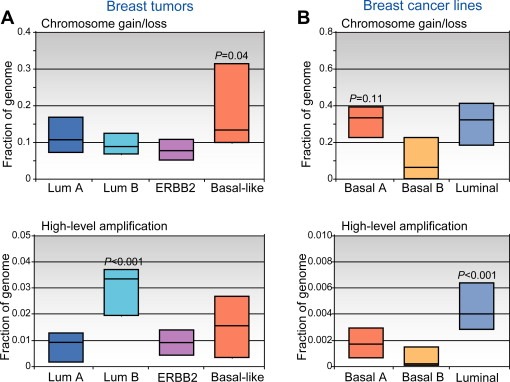
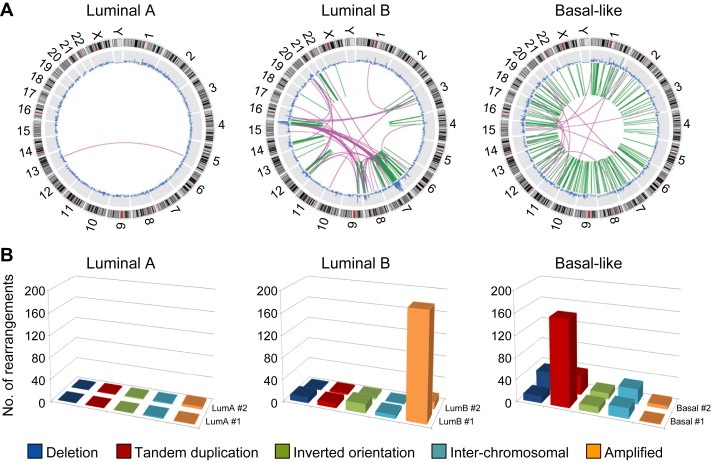
Breast cancer is a heterogeneous disease, appreciable by molecular markers, gene-expression profiles, and most recently, patterns of genomic alteration. In particular, genomic profiling has revealed three distinct patterns of DNA copy-number alteration: a "simple" type with few gains or losses of whole chromosome arms, an "amplifier" type with focal high-level DNA amplifications, and a "complex" type marked by numerous low-amplitude changes and copy-number transitions. The three patterns are associated with distinct gene-expression subtypes, and preferentially target different loci in the genome (implicating distinct cancer genes). Moreover, the different patterns of alteration imply distinct underlying mechanisms of genomic instability. The amplifier pattern may arise from transient telomere dysfunction, although new data suggest ongoing "amplifier" instability. The complex pattern shows similarity to breast cancers with germline BRCA1 mutation, which also exhibit "basal-like" expression profiles and complex-pattern genomes, implicating a possible defect in BRCA1-associated repair of DNA double-strand breaks. As such, targeting presumptive DNA repair defects represents a promising area of clinical investigation. Future studies should clarify the pathogenesis of breast cancers with amplifier and complex-pattern genomes, and will likely identify new therapeutic opportunities.


Figures

Figure 1
Figure 1
Genomic profiling studies have identified distinct patterns of CNA among different breast cancers. Exemplary genomic profiles are shown here for individual breast tumors representing (A) “Simple” (“1q/16”) pattern, characteristic of luminal A tumors; (B) “Amplifier” (“firestorm”) pattern, typical of luminal B tumors. Note, in this tumor highest amplifications are seen within 1p, 2q and 6q (potentially pinpointing novel oncogenes), though more commonly occur at sites like 8p (FGFR), 11q (CCND1), and 20q (ZNF217); (C) “Amplifier” pattern, also typical for ERBB2 tumors. Note highest peak at 17q12 (ERBB2); (D) “Complex” (“sawtooth”) pattern, characteristic of basal‐like tumors. For each of the above graphs, the red trace represents the segmented CGH profile (tumor/normal fluorescence log2 ratio vs. genome map position), obtained using cghFLasso (Tibshirani and Wang, 2008). cDNA microarray CGH data are from Bergamaschi et al. (2006) and Bergamaschi et al. (2008). (For interpretation of the references to colour in this figure legend, the reader is referred to the web version of this article.)
Figure 2
Figure 2
Molecular (gene‐expression) subtypes of breast cancer have been associated with distinct patterns of CNA. (A) Breast tumors classified by expression pattern (luminal A, luminal B, ERBB2, and basal‐like) display varying levels of low‐amplitude chromosome segment gain/loss (above), and of high‐level DNA amplification (below). Box plots display the 25th, 50th (median), and 75th percentiles of genome (cytoband) fraction altered among tumors classified (by expression profiles) to each subtype. Note that basal‐like tumors exhibit higher levels of segmental gain/loss, while luminal B tumors show more high‐level DNA amplifications (P‐values represent comparisons of the one group vs. all others). (B) Breast cancer cell lines, which can be classified by expression patterns to luminal or to one of either of two basal‐like groups (Neve et al., 2006; Kao et al., 2009), display analogous CNA patterns. Fraction of genome (genes) altered is displayed, as above. “Basal A” lines, which are most similar to basal‐like tumors (Kao et al., 2009), exhibit high levels of segmental gain/loss (P‐value compared to basal‐B group), while luminal lines show more high‐level DNA amplifications (compared to basal lines). Breast lines therefore provide a relevant model system to study the underlying genomic instabilities. Data shown are from Bergamaschi et al. (2006) and Kao et al. (2009).
Figure 3
Figure 3
“Next‐Gen” DNA sequencing has revealed distinct patterns of genomic rearrangements among different breast cancers. (A) Exemplary patterns are shown for tumors classified by expression pattern as luminal A (left), luminal B (center), and basal‐like (right). In these “Circos” plots, the outer ring indicates genome position, the blue trace represents DNA copy number determined by counting sequencing reads (gains point to outside, losses to inside), and within the inner ring the green and purple lines represent intrachromosomal and interchromosomal rearrangements, respectively, identified by genome alignment of paired‐end sequence reads from small genomic fragments. Reprinted by permission from Macmillan Publishers Ltd: (Stephens et al., 2009). (B) Rearrangement architectures of luminal A (left), luminal B (center), and basal‐like (right) tumors, shown for the two tumors profiled from each group (the “front‐most” samples correspond to the Circos plots above). Bars indicate deletion (dark blue), tandem duplication (red), inverted orientation (green), interchromosomal rearrangements (light blue), and rearrangements within amplified regions (orange). Note, though the sample size is small, increased rearrangements within amplified regions are apparent in luminal B tumors, while intrachromosomal tandem duplications are prevalent in sporadic basal‐like tumors (as well as in BRCA1‐associated tumors, not shown). Data graphed here are from Stephens et al. (2009). (For interpretation of the references to colour in this figure legend, the reader is referred to the web version of this article.)
Figure 4
Figure 4
DNA amplification arising by breakage‐fusion‐bridge (BFB) cycles. Cycle 1 initiates with chromosome breakage (A), occurring for example at a fragile site, or functionally emulated by critically shortened telomere sequences. Following chromosome replication in S‐phase to form sister chromatids (B), the break can be repaired (via NHEJ) by sister chromatid fusion (C). The resultant dicentric chromosome forms an anaphase bridge (D) when the two centromeres are pulled to opposite spindle poles, ultimately resolved by random chromosome breakage (E). The resultant broken chromosome provides a starting point for a subsequent BFB cycle. The blue arrowhead denotes a DNA segment residing proximal to the breakpoint, which becomes duplicated (note inverted structure) following the BFB cycle. Each subsequent BFB cycle can lead to additional duplication (cycle 2 product shown in (F)), resulting in an array of amplified DNA with characteristic inverted repeat architecture. (For interpretation of the references to colour in this figure legend, the reader is referred to the web version of this article.)
Figure 5
Figure 5
A possible “DNA amplifier” phenotype in breast cancer. (A) Segmented cDNA array CGH (log2 ratio) profile of two breast cancer cell lines, CAL51 (above), a diploid line with microsatellite instability (Seitz et al., 2003), and MDA‐MB‐468, a basal‐like line that also harbors focal high‐level DNA amplification at 7p11.12 (EGFR). To evaluate DNA amplification frequency, cells were plated and exposed to PALA at a concentration corresponding to nine times the lethal dose (LD50) for approximately four weeks, and the frequency of PALA resistant (PALAR) colonies (arising by CAD gene amplification at 2p23.3 (Tlsty et al., 1989)) determined. Despite comparably high cell plating efficiencies, MDA‐MB‐468 exhibited a more than 1000‐fold higher amplification frequency (PALAR colony frequencies indicated). This finding suggests the possibility that some breast cancers, possibly those already harboring amplicons, retain a competency to amplify DNA at other loci, i.e. an “amplifier” phenotype. (B) Oligonucleotide array CGH log2 ratios (blue dots) and segmented profile (red line) for chr2 in parent MDA‐MB‐468 line (above), and for three independent PALAR colonies (below), confirming focal DNA amplification at CAD (arrow). Note, the low‐level segmental gain of distal 2p seen in the parent line may provide an architecture contributing to the particularly high amplification rates (10−2) observed in MDA‐MB‐468; study of additional lines is warranted. Rare PALAR colonies of CAL51 exhibited whole chr2 gain (not shown). (C) Fluorescence in situ hybridization (FISH) confirming DNA amplification of CAD in a PALAR clone (below), compared to the parental line (above). Amplification of CAD in the PALAR clone is evident by the increased numbers of green (CAD locus) compared to red signals (control chr2 centromere probe). Note, the clustering of green signals observed in the interphase nucleus (filled arrow) and metaphase spread (open arrow) is indicative of in situ DNA amplification of CAD on chr2. (For interpretation of the references to colour in this figure legend, the reader is referred to the web version of this article.)

References

    1. Albertson, D.G. , 2006. Gene amplification in cancer. Trends Genet. 22, 447–455. - PubMed
    1. Alli, E. , Sharma, V.B. , Sunderesakumar, P. , Ford, J.M. , 2009. Defective repair of oxidative DNA damage in triple-negative breast cancer confers sensitivity to inhibition of poly(ADP-ribose) polymerase. Cancer Res. 69, 3589–3596. - PMC - PubMed
    1. Artandi, S.E. , DePinho, R.A. , 2000. A critical role for telomeres in suppressing and facilitating carcinogenesis. Curr. Opin. Genet. Dev. 10, 39–46. - PubMed
    1. Bergamaschi, A. , Kim, Y.H. , Wang, P. , Sorlie, T. , Hernandez-Boussard, T. , Lonning, P.E. , Tibshirani, R. , Borresen-Dale, A.L. , Pollack, J.R. , 2006. Distinct patterns of DNA copy number alteration are associated with different clinicopathological features and gene-expression subtypes of breast cancer. Genes Chromosomes Cancer. 45, 1033–1040. - PubMed
    1. van Beers, E.H. , van Welsem, T. , Wessels, L.F. , Li, Y. , Oldenburg, R.A. , Devilee, P. , Cornelisse, C.J. , Verhoef, S. , Hogervorst, F.B. , van't Veer, L.J. , Nederlof, P.M. , 2005. Comparative genomic hybridization profiles in human BRCA1 and BRCA2 breast tumors highlight differential sets of genomic aberrations. Cancer Res. 65, 822–827. - PubMed

Publication types