Comparative Study
. 2010 Sep;94(2):127-44.
doi: 10.1016/j.nlm.2010.04.009. Epub 2010 Apr 29.

Remodeling the cortex in memory: Increased use of a learning strategy increases the representational area of relevant acoustic cues

Affiliations
Comparative Study

Remodeling the cortex in memory: Increased use of a learning strategy increases the representational area of relevant acoustic cues

Kasia M Bieszczad et al. Neurobiol Learn Mem. 2010 Sep.

Abstract

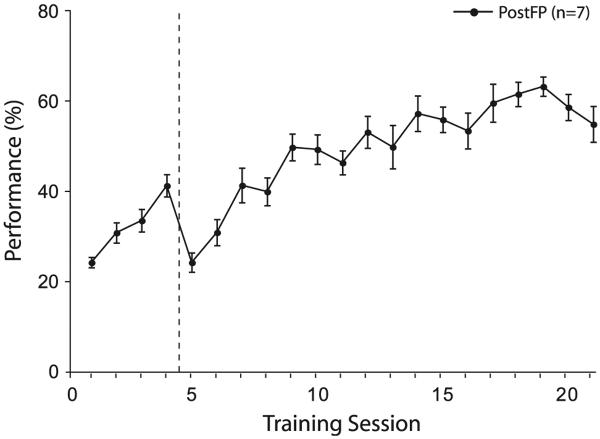
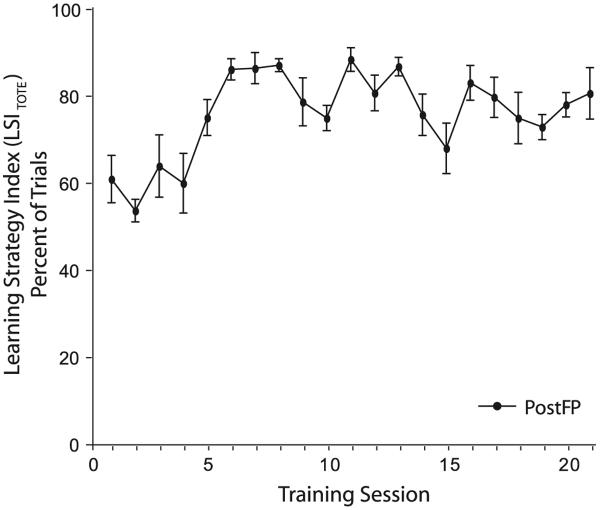
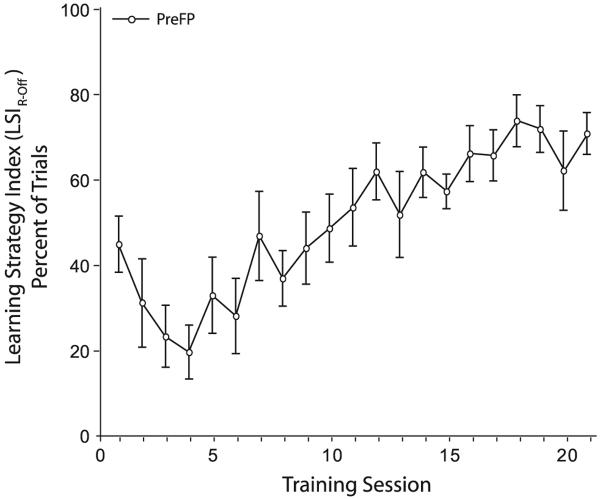
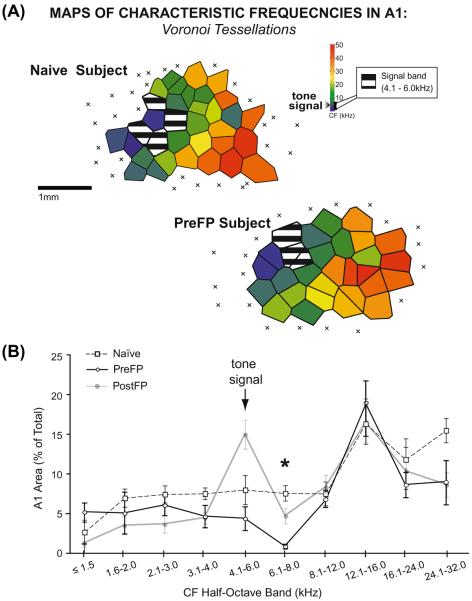
Associative learning induces plasticity in the representation of sensory information in sensory cortices. Such high-order associative representational plasticity (HARP) in the primary auditory cortex (A1) is a likely substrate of auditory memory: it is specific, rapidly acquired, long-lasting and consolidates. Because HARP is likely to support the detailed content of memory, it is important to identify the necessary behavioral factors that dictate its induction. Learning strategy is a critical factor for the induction of plasticity (Bieszczad & Weinberger, 2010b). Specifically, use of a strategy that relies on tone onsets induces HARP in A1 in the form of signal-specific decreased threshold and bandwidth. The present study tested the hypothesis that the form and degree of HARP in A1 reflects the amount of use of an "onset strategy". Adult male rats (n=7) were trained in a protocol that increased the use of this strategy from approximately 20% in prior studies to approximately 80%. They developed signal-specific gains in representational area, transcending plasticity in the form of local changes in threshold and bandwidth. Furthermore, the degree of area gain was proportional to the amount of use of the onset strategy. A second complementary experiment demonstrated that use of a learning strategy that specifically did not rely on tone onsets did not produce gains in representational area; but rather produced area loss. Together, the findings indicate that the amount of strategy use is a dominant factor for the induction of learning-induced cortical plasticity along a continuum of both form and degree.


Figures

Fig. 1
Fig. 1. PostFP training protocol and the TOTE pattern of behavior
The Free Period occurs immediately after the presentation of the tone in the PostFP protocol. Animals using the TOTE-strategy will begin bar-pressing to the onset of the tone persist immediately after the tone during the Free Period, and continue to bar-press during the inter-trial interval immediately following the last reward until the flashing light error signal cues them to cease. Case 1 exemplifies the TOTE pattern of behavior. However, several patterns of behavior were possible with PostFP training that could result in three, two, one, or no rewards. Case 1 shows a pattern of bar-pressing that results in 3 rewards. Case 2 shows a pattern that also results in 3 rewards, however note the longer latency to bar-press during the Free Period: bar-press (e) in Case 2 occurs at the same time relative to the tone as bar-press (d) in Case 1, however this bar-press is either rewarded, or signaled as an error, respectively. Recall that only the first bar-press within the 7 s Free Period window is rewarded and the next bar-press is always signaled as an error. Case 3 shows a situation where only 2 rewards are delivered because only one bar-press was made during the tone. Again, note the different outcomes for bar-press (g) and bar-presses (e) and (d). Case 4 shows a pattern of response that results in the delivery of only one reward. No responses were made during the Free Period. Note that bar-press (g) is signaled as an error as the first bar-press during the inter-trial interval after the last rewarded bar-press the animal received. Case 5 demonstrates that PostFP subjects are required to bar-press at least once during the tone in order to receive an opportunity for reward during the Free Period. Contrast bar-press (c) with bar-press (b) in Case 3 and (a) in Case 1; all responses occur at the same time relative to the tone, but only the latter two bar-presses are rewarded. Case 5 also demonstrates a situation in which bar-presses continue during the error-signal time-out period. Each bar-press within the time-out duration initiates a new time-out period until bar-presses are withheld for at least one complete time-out duration. Asterisks across Cases 1–5 show that the delivery of errors during ITIs are randomly scheduled for 50% of inter-trial interval bar-presses. Only the first bar-press during an inter-trial interval after the last reward period is signaled as an error 100% of the time.
Fig. 2
Fig. 2. PostFP group performance
Performance ([# tone BPs/(# tone BPs + # error BPs)] × 100%) increases across sessions until reaching an asymptote of 57.7% (±1.8 s.e.) over the last four training sessions. Dashed line indicates shift in protocol from short inter-trial interval durations (first four days = 4–12 s, random schedule), to long inter-trial interval durations (5–25 s, random schedule).
Fig. 3
Fig. 3. TOTE behavior in the PostFP group
The PostFP learning strategy index (LSITOTE) increases with training. The proportion of trials with TOTE patterns of response increases until session 5 when the group is at an asymptote of 79.8% (±4.0 s.e.).
Fig. 4
Fig. 4. PostFP group's frequency generalization gradient
The PostFP group learned about specific frequency. Subjects showed a peak in response at (5.0 kHz) or near (7.5 kHz) the signal-frequency.
Fig. 5
Fig. 5. Representation of frequency across A1 in the PostFP group
(A) Example map of characteristic frequency (CF) from a PostFP subject shows an increase in signal-area relative to a naïve subject. Striped polygons show the area of representation of the signal-frequency within a half-octave band. (B) The amount of area for the signal-frequency was determined relative to the size of A1 (y-axis, % of total). CF distributions in half-octave bands reveal a significant area gain in the signal-frequency band in the PostFP group compared to the naïve group only for the signal-frequency (asterisk). The gain roughly doubled the area of representation for the signal-frequency from 7.67% (±1.62 s.e.) in naïves to 15.13% (±1.85 s.e.) in PostFP subjects.
Fig. 6
Fig. 6. Specific plasticity in A1 is enhanced with greater use of the TOTE-strategy
Prior groups learning with the TOTE-strategy [“B&W 2008” (Berlau and Weinberger, 2008) and “B&W 2010” (Bieszczad & Weinberger, 2010b)] developed HARP in the form of increases in tuning sensitivity and selectivity for the signal-frequency. Greater use of the TOTE-strategy in PostFP subjects induced a transition to a higher form of HARP in gains in area for the signal-frequency. LSITOTE is significantly different in all three groups (B&W 2008 vs. B&W 2010, t(12) = 4.01, p < 0.01; PostFP vs. B&W 2008, t(13) = 31.31, p < 0.0001; PostFP vs. B&W 2010, t(11) = 19.23, p < 0.0001; marked by asterisks) and predicts the degree of HARP in A1. The first form of HARP induces decreases in both threshold and bandwidth (BW) that are specific to the conditioned tone (CS). Such CS-specific tuning changes occur without any change in the cortical area of frequency representation (Berlau and Weinberger, 2008; Bieszczad & Weinberger, 2010b). B&W 2008 animals developed a ~9.0 dB SPL decrease in threshold at CF, and a ~0.7 octave decrease in BW20 while B&W 2010 animals showed a ~8.5 dB SPL decrease in threshold and ~0.5 octave decrease in BW10, but no change in BW20. Modest use of the TOTE-strategy could induce HARP without area gain as an initial or primitive form of plasticity since the number of cells involved are limited (i.e., responses change only for those cells tuned to the signal-frequency). The second form of HARP induced by increased use of the TOTE-strategy is enhanced from the first. Because shifts in tuning of neighboring cells could underlie the gain in area of representation of the signal-frequency, this form of HARP involves more cells, i.e., those tuned both above and below the signal-frequency. Thus, changes in cortical representational area can be considered as an enhanced or higher level form of HARP.
Fig. 7
Fig. 7. The degree to which PostFP subjects use the TOTE-strategy correlates with the amount of area gain in A1
A PostFP subject that uses a TOTE-strategy will have a pattern of response that begins with bar-presses after tone onset and continue until an error signal is received, without reference to the tone's offset. The degree of TOTE-strategy use was assessed by analyzing the behavior during 10 test trials without Free Periods to determine a TOTE-Learning Index (TLI). The TOTE-strategy could be assessed by the presence of a single bar-press within a 5 s post-tone interval that was not followed by subsequent responses. This pattern of behavior would reveal that animals used the error signal, and not the tone offset, to stop responding for rewards. A TLI value of 1.0 indicates the tone's offset was ignored and the error cue initiated by a single bar-press was used to withhold further responses. A value of 0.0 indicates that the tone's offset was used to withhold responding because bar-presses after the tone were absent. Thus, greater TLI values indicate greater use of the TOTE-strategy (x-axis). Greater use of the TOTE-strategy predicts larger gains of signal representation in A1 (r = 0.84, p < 0.01) (y-axis, relative area in A1 within a quarter-octave of the signal in individual PostFP subjects). Solid and dashed lines show the naïve group's average amount of relative area in A1 at the signal-frequency band (7.67 ± 1.62%).
Fig. 8
Fig. 8. PreFP training protocol and the R-Off pattern of behavior
The Free Period occurs immediately before the presentation of the tone in the PreFP protocol. Animals using the R-Off strategy will begin bar-pressing upon the delivery of a reward, continue throughout the tone and stop at tone offset. PreFP trials had many possible patterns of behavior that result in three, two, one, or no rewards. Case 1 shows one possible response profile for a PreFP subject to obtain 3 rewards. A maximum of 2 rewards are possible during the tone and 1 reward during the free period. The first bar-press during the free period initiates the reward period (a). Only the first bar-press during the inter-trial-interval after the last reward is signaled as an error by a flashing light and time-out, i.e., extension of time until the next trial (e). All remaining bar-presses during the inter-trial-intervals are not signaled as errors. Case 2 also shows a scenario for 3 rewards. In this case, the first bar-press during the free period does not occur until later during the Free Period window (b). A tone immediately follows the free period reward as the trial continues. Notice that the first rewarded bar-press in this case (b) occurs at the time of the second rewarded bar-press in Case 1 (d). This demonstrates how the animal's response determines the time of tone presentation. Notice also that bar-presses (e) and (f) occur at the same latency after the start of the free period in Case 1 and Case 2 respectively, however these are signaled as an error or reward depending on the prior bar-pressing behavior during the trial. Case 3 shows a scenario in which 2 rewards were delivered, one during the tone and the second during the Free Period. Regardless of the latency and total number of bar-presses made during the tone, the first bar-press during the inter-trial interval is always signaled as an error. Case 3 also demonstrates the possibility of an “error loop” that occurs if bar-presses are made during an error-signaled time-out period (as in Case 5 in the PostFP protocol, Fig. 1B). These bar-presses reset the time-out period until bar-presses are withheld for the complete duration of at least one time-out period. Error loops only begin after the first inter-trial-interval bar-press because this is the only instance for which bar-presses result in error-signaled time-outs. Case 4 shows a scenario that only includes one rewarded response during the trial. A bar-press was made during the free period and rewarded to initiate a tone trial, but bar-presses did not occur during the tone. Again, the first bar-press after the tone is always signaled as an error, even without rewarded responses during the tone. Case 5 shows the only scenario in which a trial may occur without any rewards in the PreFP protocol. If bar-presses are absent once the free period begins, the inter-trial time will continue until a bar-press is made. The next bar-press will result in reward and initiate the tone trial. This scenario was extremely rare during training. All PreFP animals learned to obtain rewards by initiating trials. Asterisks indicate the bar-press at the beginning of the inter-trial interval period during which error signals were no longer delivered. Inter-trial interval bar-presses that followed the first bout of bar-pressing after the tone were not signaled as errors to ensure that subjects could initiate subsequent trials.
Fig. 9
Fig. 9. PreFP group performance
Performance (P = [# tone BPs/(# tone BPs + # error BPs)] 100%) increases across sessions until reaching an asymptote of 39.5% (±4.2 s.e.) over the last four training sessions.
Fig. 10
Fig. 10. Use of tone offsets revealed in the PreFP group's behavior
(A) Responses during the post-tone-interval (PTI, 5 s) decrease across training sessions in the PreFP group. PTI is shown as the percent change relative to the first day of training. (B) Latency to bar-press after the tone offsets reveals their use to stop bar-pressing. The PreFP group's latency to respond after tone offset significantly increased with training.
Fig. 11
Fig. 11. PreFP learning strategy index (LSIR-Off) increases with training
The proportion of trials with R-Off patterns of response increases until session 9 when the group is at an asymptote of 60.1% (±7.1 s.e.).
Fig. 12
Fig. 12. PreFP group's frequency generalization gradient
The PreFP group learned about specific frequency. Subjects showed a peak in response at (5.0 kHz) or near (7.5 kHz) the signal-frequency (however the peak did not reach statistical significance) that was not different from the specificity of behavior in the other trained group.
Fig. 13
Fig. 13. Representation of frequency across A1 in the PreFP group
(A) Example map of characteristic frequency (CF) from a PreFP subject shows no change in signal-area relative to a naïve subject. Striped polygons show the area of representation of the signal-frequency within a half-octave band. (B) The amount of area for the signal-frequency was determined relative to the size of A1 (y-axis, % of total). CF distributions in half-octave bands do not reveal area gains in the signal- or any other signal-frequency band compared to the naïve group. Instead, the PreFP group showed a non-specific decrease from 7.24% (±1.30) in naïves to 0.67% (±0.33) in A1 area in the half-octave band immediately above that of the signal-frequency (asterisk). Light gray line shows the gain in area in the PostFP group for comparison between trained groups.
Fig. 14
Fig. 14. Comparison of PreFP group behavior with PostFP during test trials without Free Periods
(A) The number of responses during tones on ten test trials without Free Periods was not different between groups. Therefore, PreFP subjects made use of the signal tone to the same degree as the PostFP group. (B) The PreFP group responded significantly less during the interval that followed the offset of tones (i.e., post-tone interval, PTI) than the PostFP group. These patterns of behavior could be predicted by the use of the R-Off or TOTE strategies and reflect the PreFP group's stability of R-Off strategy use prior to electrophysiological recording.

Similar articles

Cited by

References

    1. Bakin JS, South DA, Weinberger NM. Induction of receptive field plasticity in the auditory cortex of the guinea pig during instrumental avoidance conditioning. Behavioral Neuroscience. 1996;110(5):905–913. - PubMed
    1. Bakin JS, Weinberger NM. Classical conditioning induces CS-specific receptive field plasticity in the auditory cortex of the guinea pig. Brain Research. 1990;536(1–2):271–286. - PubMed
    1. Bao S, Chang EF, Woods J, Merzenich MM. Temporal plasticity in the primary auditory cortex induced by operant perceptual learning. Nature Neuroscience. 2004;7(9):974–981. - PubMed
    1. Beitel RE, Schreiner CE, Cheung SW, Wang X, Merzenich MM. Reward-dependent plasticity in the primary auditory cortex of adult monkeys trained to discriminate temporally modulated signals. Proceedings of the National Academy of Sciences of the United States of America. 2003;100(19):11070–11075. - PMC - PubMed
    1. Berlau KM, Weinberger NM. Learning strategy determines auditory cortical plasticity. Neurobiology of Learning and Memory. 2008;89(2):153–166. - PMC - PubMed

Publication types