Review
. 2010 Jun;28(6):281-90.
doi: 10.1016/j.tibtech.2010.03.002. Epub 2010 Apr 29.

Single cell analysis: the new frontier in 'omics'

Affiliations
Review

Single cell analysis: the new frontier in 'omics'

Daojing Wang et al. Trends Biotechnol. 2010 Jun.

Abstract

Cellular heterogeneity that arises from stochastic expression of genes, proteins and metabolites is a fundamental principle of cell biology, but single cell analysis has been beyond the capability of 'omics' technology. This is rapidly changing with the recent examples of single cell genomics, transcriptomics, proteomics and metabolomics. The rate of change is expected to accelerate owing to emerging technologies that range from micro/nanofluidics to microfabricated interfaces for mass spectrometry to third- and fourth-generation automated DNA sequencers. As described in this review, single cell analysis is the new frontier in omics, and single cell omics has the potential to transform systems biology through new discoveries derived from cellular heterogeneity.


Figures

Figure 1
Figure 1
Observation of cellular heterogeneity. (a) mRNA expression of GAPDH from individual Jurkat cells after siRNA knockdown. The levels fall into roughly two categories: 50% and 100% knockdowns (i.e. 50% and 0% expression remained). Importantly, the average GAPDH expression obtained from the measurement of 50 cells (21±4%) was not representative of any individual cell. Adapted with permission from Ref. [6]. (b) Clustering diagram of 363 cells in C. elegans according to similarities between gene expression profiles. Distance between cells in the x-y plane indicates levels of similarity. Colors indicate different tissue types. Key: b.w.m., body wall muscle; b.neu., body neurons; re.epi., rectal epithelial cells; b.c., other body cells; int., intestine cells; hyp., hypodermal cells; blast, blast cells; ph.m., pharyngeal muscle; ph.neu., pharyngeal neurons; ph.epi., pharyngeal epithelial cells; ph.c., other pharyngeal cells. Adapted with permission from Ref. [7].
Figure 2
Figure 2
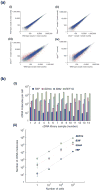
Single cell gene expression analysis. (a) Correlation plots of the quantile-normalized mRNA sequencing reads for mouse oocytes, showing (i) one wild-type oocyte versus another wild-type oocyte; (ii) one Dicer1−/− oocyte versus another Dicer1 −/− oocyte; (iii) one wild-type oocyte versus one Dicer1−/− oocyte; and (iv) one wild-type oocyte versus one Ago2−/− oocyte. All of the reads with changes of greater than fourfold are plotted in red. Adapted with permission from Ref. [24]. (b) Number of cDNA molecules measured by qPCR in single human colon carcinoma HCT116 cells and cell pools, showing (i) cell-to-cell variation in expression of “housekeeping” genes among 14 single cells, and (ii) average gene expression for single cells as well as cell pools with error bars (single cell: mean ± s.d., n=14; 10–1,000 cells: mean ± s.d., n=5). Adapted with permission from Ref. [25].
Figure 3
Figure 3
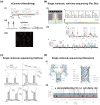
Single cell metabolome analysis. (a) Metabolomic profiling of a single Aplysia R2 neuron using CE-ESI-MS, showing the extracted ion electropherogram (XIE) obtained for 146 m/z from different subcellular regions (i.e. soma versus neurite). Adapted with permission from Ref. [33]. (b) Metabolomic profiling using LAESI-MS, showing (i) etched optical fiber for laser ablation relative to the target single cell (scale bar = 100μm), and (ii) optical image of neighboring individual colorless and pigmented epidermal cells of the purple A. cepa cultivar (scale bar = 50 μm). Also shown are the corresponding LAESI-MS spectra. Selected similar and different peaks (m/z) are indicated by arrows in the lower spectrum. Adapted with permission from Ref. [34].
Figure 4
Figure 4
New technologies for nucleic acid analysis. (a) nCounter gene expression system from NanoString Technologies, showing (i) schematic representation of the hybridized complex (not to scale); (ii) schematic representation of, from left to right, binding, electrophoresis, and immobilization; and (iii) false-color image of immobilized reporter probes. Adapted with permission from Ref. [42]. (b) Single-molecule, real-time DNA sequencing system from Pacific Biosciences, showing (i, left) schematic representation of the experimental geometry with a single molecule of DNA template-bound DNA polymerase immobilized at the bottom of a zero-mode waveguide (ZMW), (i, right) schematic event sequence of the phospholinked dNTP incorporation cycle, with a corresponding expected time trace of detected fluorescence intensity from the ZMW; (ii, top) total intensity output of all four dye-weighted channels with pulses colored corresponding to the least-squares fitting decisions of the algorithm, and (ii, bottom) the entire read that proceeds through all 150 bases of the linear templates. Adapted with permission from Ref. [44]. (c) Single-molecule sequencing digital gene expression system from Helicos Biosciences, illustrating sample preparation and sequencing workflow: (1) preparation of the first-strand cDNA from mRNA, (2) addition of 3′ tail of dATP followed by dideoxy-TTP (ddT) blocking, (3) hybridization of tailed sample to poly-dT oligonucleotide covalently attached to the flow-cell channel surface, (4) sequencing of a single base by adding a Cy5-labeled nucleotide, (5) cleaving off the Cy5 dye label, and (6) adding and imaging of next nucleotide. Adapted with permission from Ref. [45]. (d) Single-molecule nanopore sequencing system from Oxford Nanopore Technologies, showing (i, left) nanopore structure of the WT- (M113R/N139Q)6(M113R/N139Q/L135C)1 mutant with the cyclodextrin covalently attached at position 135 (space-filling model), and (i, right) close-up of the β barrel with the arginines at position 113 and the location of the cysteines in the mutants tested in the study; and (ii) single-channel recording from the nanopore that indicates discrimination of dGMP, dTMP, dAMP, and dCMP, with colored bands representative of the residual current distribution for each nucleotide. Adapted with permission from Ref. [46].
Figure 5
Figure 5
New technologies for protein and metabolite analysis. (a) A single-cell encapsulator, showing (i) the channel systems, and (ii) a string of droplets generated. Adapted with permission from Ref. [53]. (b) A single cell analysis chip, showing the cell manipulation section on the left and the molecule counting section on the right. Adapted with permission from Ref. [59]. (c) An integrated blood barcode chip, comprising channels that harness the Zweifach-Fung effect for plasma separation from a finger prick of blood as well as multiple DNA-encoded antibody DEAL barcode arrays patterned on the surface of the plasma-skimming channel. Adapted with permission from Ref. [60]. (d) Microfabricated monolithic multinozzle emitters (M3 emitters), showing (i) a schematic view of a nanoelectrospray emitter with two protruding nozzles, and (ii) SEM images and corresponding magnified views of the M3 emitters with different nozzle numbers (1–10) and dimensions. Adapted with permission from Ref. [62].

References

    1. Irish JM, et al. Mapping normal and cancer cell signalling networks: towards single-cell proteomics. Nat Rev Cancer. 2006;6:146–155. - PubMed
    1. Graf T, Stadtfeld M. Heterogeneity of embryonic and adult stem cells. Cell Stem Cell. 2008;3:480–483. - PubMed
    1. Cai L, et al. Stochastic protein expression in individual cells at the single molecule level. Nature. 2006;440:358–362. - PubMed
    1. Rosenfeld N, et al. Gene regulation at the single-cell level. Science. 2005;307:1962–1965. - PubMed
    1. Weinberger LS, et al. Stochastic gene expression in a lentiviral positive-feedback loop: HIV-1 Tat fluctuations drive phenotypic diversity. Cell. 2005;122:169–182. - PubMed

Publication types

MeSH terms