. 2010 Apr 29;66(2):315-26.
doi: 10.1016/j.neuron.2010.03.025.

Frontal cortex and the discovery of abstract action rules

Affiliations

Frontal cortex and the discovery of abstract action rules

David Badre et al. Neuron. .

Abstract

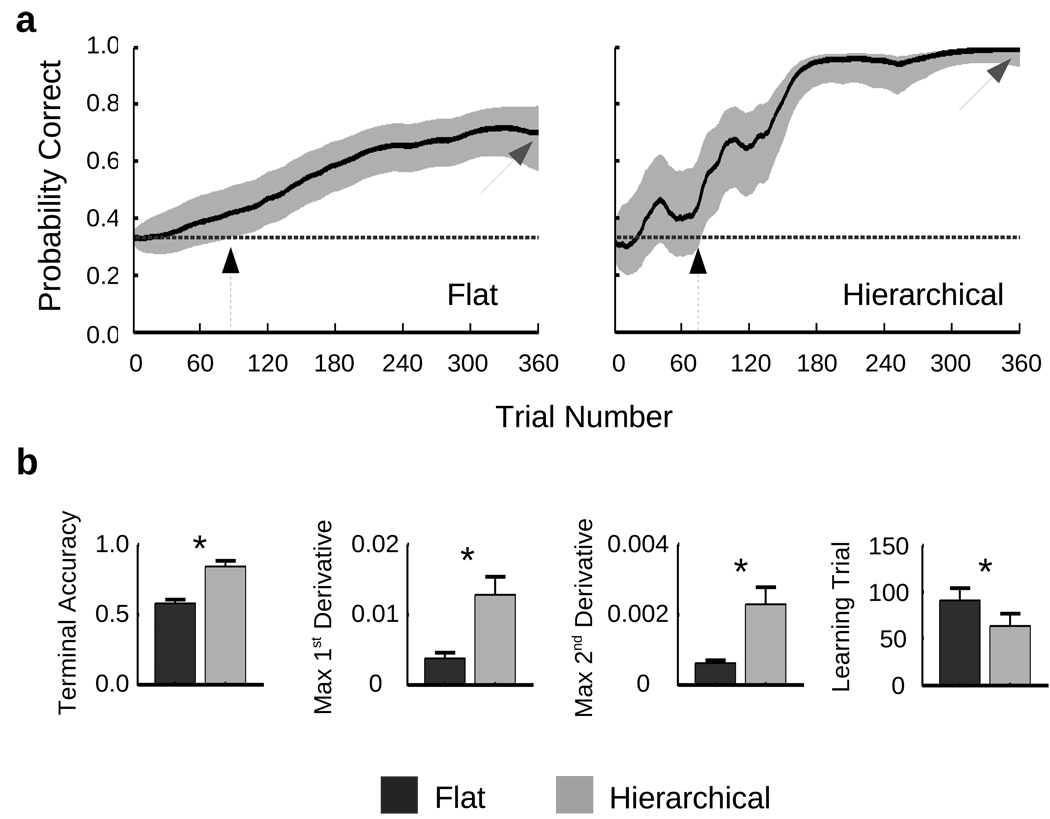
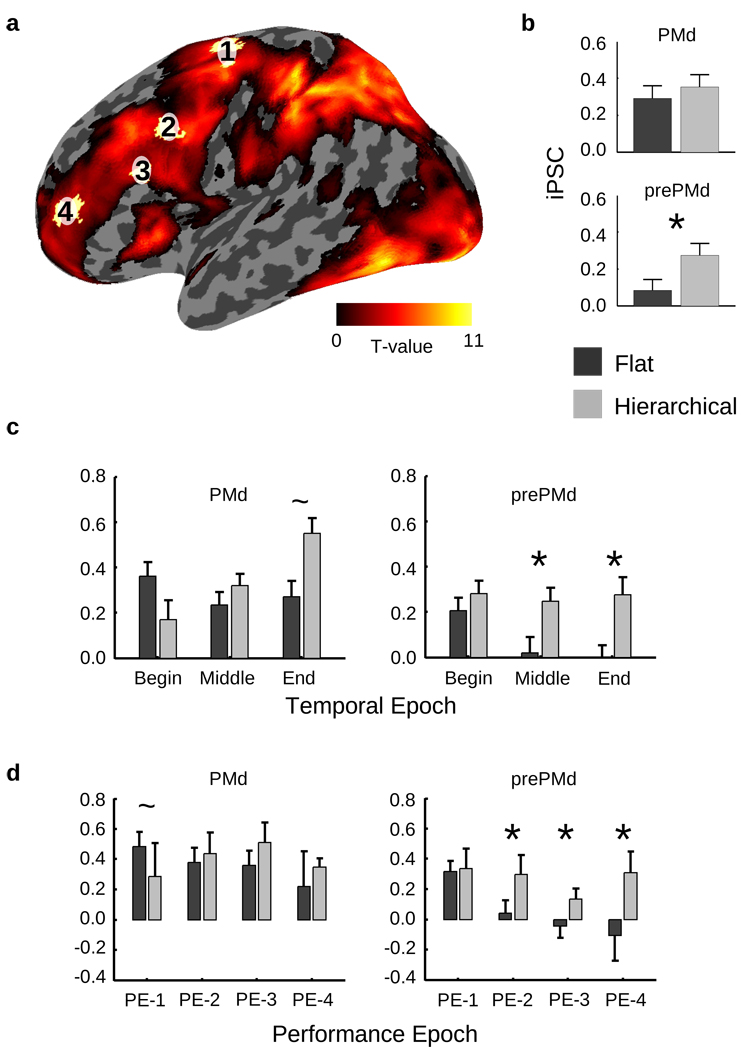
Although we often encounter circumstances with which we have no prior experience, we rapidly learn how to behave in these novel situations. Such adaptive behavior relies on abstract behavioral rules that are generalizable, rather than concrete rules mapping specific cues to specific responses. Although the frontal cortex is known to support concrete rule learning, less well understood are the neural mechanisms supporting the acquisition of abstract rules. Here, we use a reinforcement learning paradigm to demonstrate that more anterior regions along the rostro-caudal axis of frontal cortex support rule learning at higher levels of abstraction. Moreover, these results indicate that when humans confront new rule learning problems, this rostro-caudal division of labor supports the search for relationships between context and action at multiple levels of abstraction simultaneously.


Figures

Figure 1
Figure 1
Schematic depiction of trial events, example stimulus-to-response mappings, and policy for Hierarchical and Flat rule sets. (a) Trials began with presentation of a stimulus followed by a green fixation cross. Participants could respond with a button press at any time while the stimulus or green fixation cross was present. After a variable delay following the response, participants received auditory feedback indicating whether the response they had chosen was correct given the presented stimulus. Trials were separated by a variable null interval. (b) Example stimulus-to-response mappings for the Flat set. The arrangement of mappings for the Flat set was such that no higher-order relationship was present; thus, each rule had to be learned individually. (c) This set of many 1st-order rules can be represented as a large, Flat policy structure with only one level and eighteen alternatives. (d) Example stimulus-to-response mappings for the Hierarchical set. Response mappings are grouped such that in the presence of a red square, only shape determines the response, while in the presence of a blue square only orientation determines the response. (e) The Hierarchical set can be represented as a two-level policy structure with a 2nd-order rule selecting between the shape or orientation mapping sets, and a set of 1st-order rules then relating specific shapes or orientations to responses.
Figure 2
Figure 2
Behavioral data. (a) Shown are the learning curve estimates, bounded by a 90% confidence interval, for the single subject whose learning trials for the Hierarchical and Flat sets were closest to the group means for each condition (Hierarchical = 64; Flat = 91). Black arrows illustrate the learning trial, at which the lower confidence bound rose above chance performance (33%). Gray arrows highlight the terminal accuracy. (b) Subsequent panels depict the correlates of learning ± s.e.m. across the 20 subjects for the Hierarchical and Flat sets: the terminal accuracy; the maximal first derivative of the learning curve, representing the speed of learning; the maximal second derivative of the learning curve, representing the rate of change in the speed of learning; and the learning trial (i.e. the value depicted by the black arrows in 2a). For three subjects, learning for the Flat set never rose above chance; these subjects were excluded from the calculation for the mean Flat learning trial (n = 17). (See also supplementary figure 1 for further behavioral data.)
Figure 3
Figure 3
Basic imaging results. (a) Inflated representation of the left hemisphere showing areas that demonstrated a positive main effect of task (T-values indicated by the color bar), thresholded by a false discovery rate < 0.05. The locations of regions of interest (ROIs) determined independently from a previous dataset (Badre & D’Esposito, 2007) are overlaid (from posterior to anterior, 1 = dorsal premotor cortex (PMd), 2 = pre-premotor cortex (prePMd), 3 = mid dorsolateral prefrontal cortex (mid-DLPFC), and 4 = rostro-polar cortex (RPC)). (b) For prePMd but not for PMd, total activity as measured by the integrated percent signal changes (iPSC) for correct trials only differed across learning for the Hierarchical and Flat sets (*: p < 0.05). (c) Dividing the learning curve into three temporal epochs of 120 trials each (Begin, Middle, and End) reveals that these differences in PMd emerged after the initial phase of learning for the Hierarchical set (*: p < 0.05; ~: p < 0.10). (d) Dividing the learning curve by estimated performance (see text) confirms the temporal differences seen in prePMd. (See also supplementary figure 2).
Figure 4
Figure 4
Scatter plots demonstrating brain-behavior correlations. The x-axis of each plot shows the integrated percent signal change (iPSC) for correct trials only versus baseline for the beginning phase of learning collapsed across rule set (Hierarchical/Flat) and accuracy (correct/error) for PMd (left plots) and prePMd (right plots). This early learning activation across rule sets is plotted against the difference in learning trial (row 1), terminal accuracy (row 2), max 1st derivative (3rd row), and max 2nd derivative (row 4) between Hierarchical and Flat rule sets.
Figure 5
Figure 5
Striatum/GC analyses. (a) Areas within the striatum demonstrating a positive main effect of task were identified in both caudate and putamen. Across time, the integrated percent signal change (iPSC) in both areas for correct trials only tended to be greater in the Hierarchical than the Flat case (*: p < 0.05; ~: p < 0.10). (b) Despite parallel striatal univariate changes, Granger causality analysis demonstrated that BOLD signal in putamen (Pt) was reliably Granger causal (*: p < 0.05; **; p < 0.0005) for activity within PMd and prePMd, which was in turn reliably Granger causal for activity in the caudate (Cd). (To PMd and prePMd from left putamen: GC = 0.016 and GC = 0.003, respectively; from right putamen: GC = 0.026 and GC = 0.007, respectively. From PMd and prePMd to left caudate: GC = 0.012 and GC = 0.013, respectively; to right caudate: GC = 0.022 and GC = 0.013, respectively). Slices show the main effect of task (T-values indicated by the color bar), with Pt and Cd regions of interest designated by the small circles at the origins/terminations of the GC arrows. See also supplementary figures 3 and 4, and supplementary table 1, for further details.

References

    1. Alexander GE, DeLong MR, Strick PL. Parallel organization of functionally segregated circuits linking basal ganglia and cortex. Annu Rev Neurosci. 1986;9:357–381. - PubMed
    1. Asaad WF, Rainer G, Miller EK. Neural activity in the primate prefrontal cortex during associative learning. Neuron. 1998;21:1399–1407. - PubMed
    1. Badre D. Cognitive control, hierarchy, and the rostro-caudal organization of the frontal lobes. Trends Cogn Sci. 2008;12:193–200. - PubMed
    1. Badre D, D'Esposito M. Functional magnetic resonance imaging evidence for a hierarchical organization of the prefrontal cortex. Journal of Cognitive Neuroscience. 2007;19:2082–2099. - PubMed
    1. Badre D, Hoffman J, Cooney JW, D'Esposito M. Hierarchical cognitive control deficits following damage to the human frontal lobe. Nat Neurosci. 2009;12:515–522. - PMC - PubMed

Publication types

LinkOut - more resources