. 2010 Apr;22(4):1388-403.
doi: 10.1105/tpc.109.069666. Epub 2010 Apr 30.

Translocation of Magnaporthe oryzae effectors into rice cells and their subsequent cell-to-cell movement

Affiliations

Translocation of Magnaporthe oryzae effectors into rice cells and their subsequent cell-to-cell movement

Chang Hyun Khang et al. Plant Cell. 2010 Apr.

Abstract

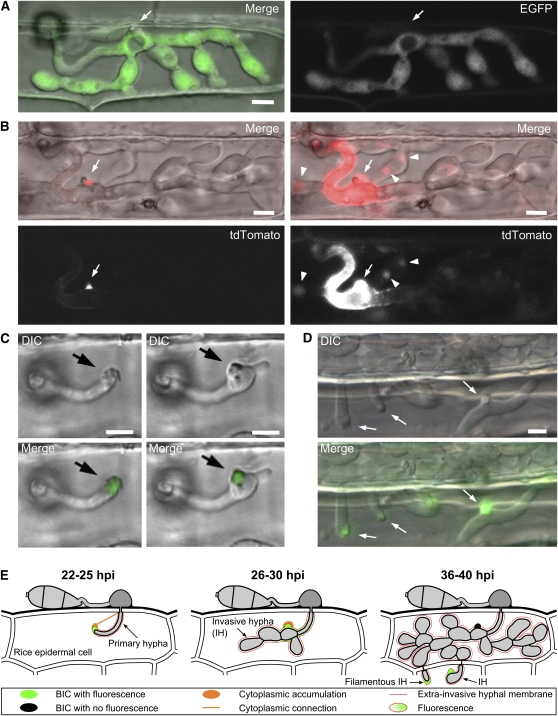
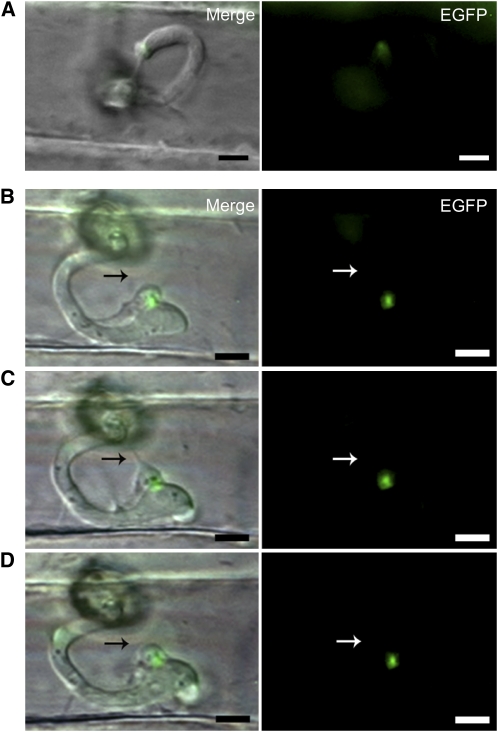
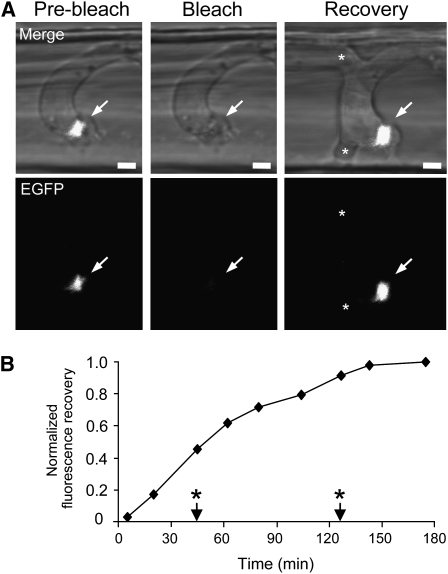
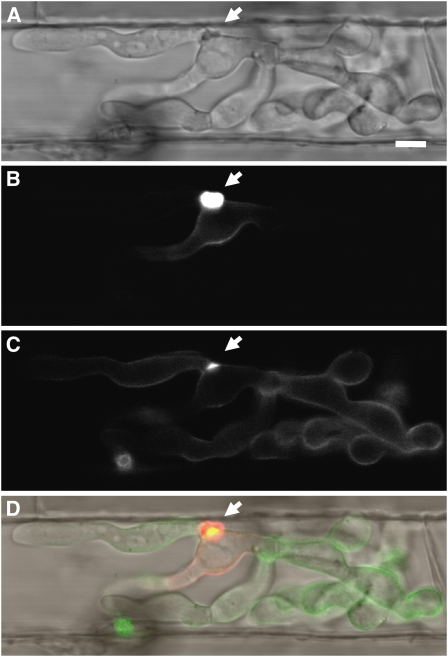
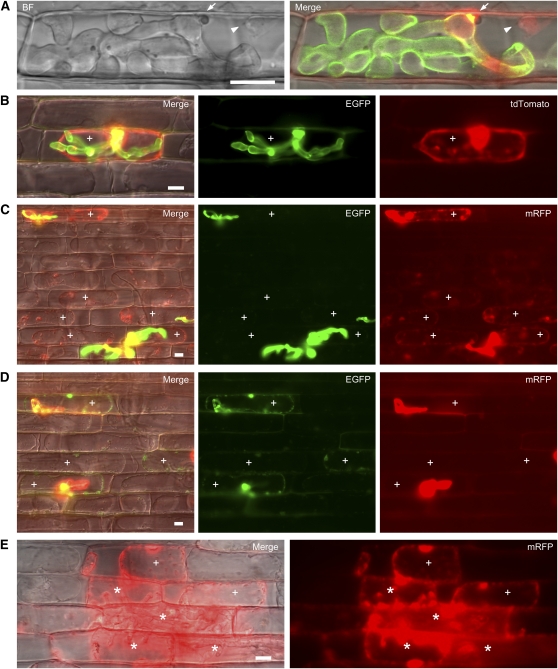
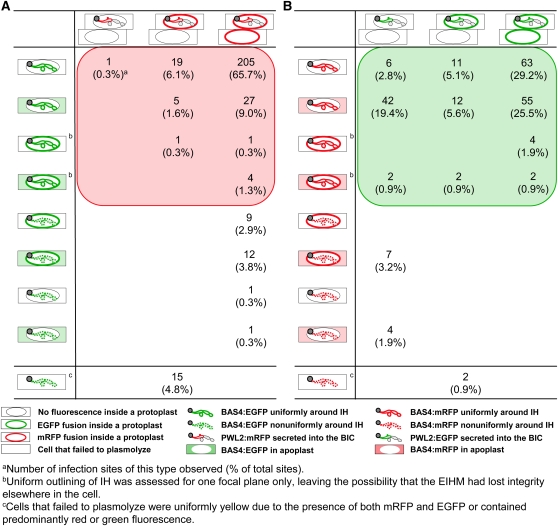
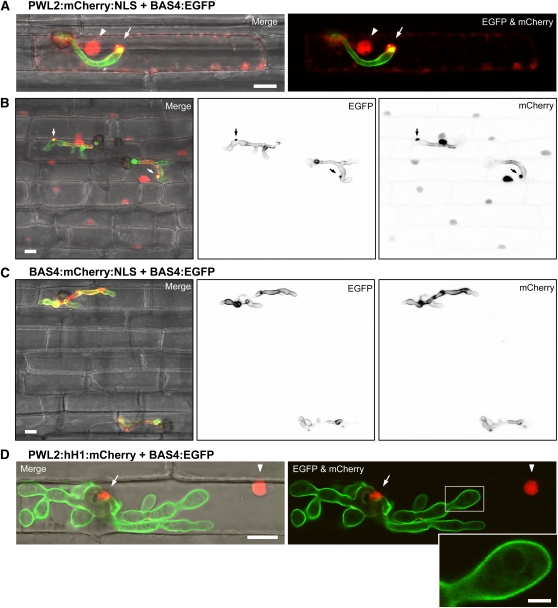
Knowledge remains limited about how fungal pathogens that colonize living plant cells translocate effector proteins inside host cells to regulate cellular processes and neutralize defense responses. To cause the globally important rice blast disease, specialized invasive hyphae (IH) invade successive living rice (Oryza sativa) cells while enclosed in host-derived extrainvasive hyphal membrane. Using live-cell imaging, we identified a highly localized structure, the biotrophic interfacial complex (BIC), which accumulates fluorescently labeled effectors secreted by IH. In each newly entered rice cell, effectors were first secreted into BICs at the tips of the initially filamentous hyphae in the cell. These tip BICs were left behind beside the first-differentiated bulbous IH cells as the fungus continued to colonize the host cell. Fluorescence recovery after photobleaching experiments showed that the effector protein PWL2 (for prevents pathogenicity toward weeping lovegrass [Eragrostis curvula]) continued to accumulate in BICs after IH were growing elsewhere. PWL2 and BAS1 (for biotrophy-associated secreted protein 1), BIC-localized secreted proteins, were translocated into the rice cytoplasm. By contrast, BAS4, which uniformly outlines the IH, was not translocated into the host cytoplasm. Fluorescent PWL2 and BAS1 proteins that reached the rice cytoplasm moved into uninvaded neighbors, presumably preparing host cells before invasion. We report robust assays for elucidating the molecular mechanisms that underpin effector secretion into BICs, translocation to the rice cytoplasm, and cell-to-cell movement in rice.


Figures

Figure 1.
Figure 1.
Two-Stage BIC Development and Preferential Effector Accumulation in Successively Invaded Rice Sheath Cells. For all images, arrows indicate BICs. Bars = 5 μm. (A) Fungal cytoplasmic EGFP (showing exclusion from the vacuoles) after expression by transformant P1-1-3 using the PWL1 promoter (30 HAI). Shown are confocal images of merged bright-field and fluorescence (left) and fluorescence alone as white (right; the arrow indicates the position of the BIC, which is not fluorescent here). (B) Restricted accumulation of PWL2:tdTomato (red) in a BIC (arrow) and around BIC-associated cells as transformant KV106 invades a YT16 rice cell at 27 HAI. Left: Confocal image with an optimal pinhole (one airy unit) shows the BIC accumulation of PWL2:tdTomato (red). Note the BIC-associated dark round body that is adjacent to the BIC on the left. Right: Confocal image with an open pinhole (10.07 airy units, almost a nonconfocal image) showed fluorescence concentrated around BIC-associated cells (primary hypha and first IH cell). PWL2:tdTomato accumulated in presumed vacuoles (arrowheads) in non-BIC IH cells, including one that branched from the primary hypha (on left). Top images: Merged bright-field and fluorescence. Bottom: Fluorescence as white. (C) First (left) and last (right, 90 min later) frames of Supplemental Movie 1 online (wide-field microscopy) demonstrating that the BIC from the primary hyphal tip was left behind when this hypha switched to bulbous IH growth. This is strain Ft080 expressing EGFP with the AVR-Pita1 promoter and signal peptide in a Yashiro-mochi cell. Merge shows DIC and EGFP images. (D) BIC development was repeated by Ft080 hyphae (same as in [C]) entering neighbor cells at 40 HAI. Wide-field microscopy with merge showing DIC and EGFP images. (E) Schematic diagram summarizing events involved in BIC development.
Figure 2.
Figure 2.
Transient Cytoplasmic Connections Tether the BIC Region to the Appressorial Penetration Site. Conventional fluorescence microscopy was used. Merge shows DIC and fluorescence images (left) and fluorescence alone (right). (A) A middle-frame image from Supplemental Movie 2 online in which a cytoplasmic strand connects a primary hyphal tip to the region of appressorial penetration. Faint BIC fluorescence is seen as transformant KV60 expressed and secreted EGFP with the P27 promoter and AVR-Pita1 signal peptide in YT16 rice at 27 HAI. (B) to (D) Shifting cytoplasm around an EGFP-labeled BIC shown in time-lapse images (40- and 33-min intervals, respectively) of KV88 in YT16 rice, secreting EGFP as in (A). A cytoplasmic connection (arrow) between the BIC region and appressorial penetration zone in (C) was not visible 33 min later in (D). Bars = 5 μm.
Figure 3.
Figure 3.
FRAP Demonstrates Continuous Secretion of PWL2:EGFP into the BIC. (A) Confocal FRAP images of KV105 secreting PWL2:EGFP into a BIC in a YT16 cell. Fluorescence in a hyphal tip BIC (Pre-bleach) was photobleached at 27 HAI (Bleach) and allowed to recover for 175 min (Recovery). Asterisks mark new IH cells that grew during this period. Arrows indicate the BIC. EGFP fluorescence is shown in white. Merge shows bright-field and EGFP. Bars = 2 μm. (B) Plot of normalized BIC fluorescence intensity recovery over time. Arrows with asterisks indicate when new hyphal branches emerged; top branch first observed at 45 min and bottom branch at 127 min.
Figure 4.
Figure 4.
Noneffector Promoter and Signal Peptide Sequences Do Not Confer Preferential BIC Localization. Confocal image of KV107 expressing EGFP with the P27 promoter and the Cutinase 1 signal peptide (P27:CUT1SP:EGFP) together with PWL2:mRFP in YT16 at 32 HAI. Arrow indicates BIC. Pinhole settings are 2 airy units for mRFP and 5 airy units for EGFP. Bar = 5 μm. (A) Bright-field image. (B) PWL2:mRFP fluorescence (red shown as white) showed preferential BIC accumulation. (C) P27:CUT1SP:EGFP fluorescence (green shown as white) outlined IH with weak fluorescence in the BIC. (D) Merged bright-field, mRFP (red), and EGFP (green) images. Yellow indicates overlapping mRFP and EGFP fluorescence.
Figure 5.
Figure 5.
PWL2:FPs, but Not BAS4:FPs, Are Translocated into the Rice Cytoplasm. Yellow (overlapping of green and red) in merged images indicates BIC-associated cells. Bars = 10 μm. (A) Confocal image of KV104 showing preferential BIC localization of PWL2:mRFP (red) and presumed translocation into invaded YT16 cytoplasm at 31 HAI. BAS4:EGFP (green) was seen outlining the IH but not in the rice cytoplasm. Pinhole settings are 1 airy unit for EGFP and 5 airy units for mRFP. Arrow indicates BIC. Arrowhead indicates presumed nucleus. Merge shows bright-field (BF), EGFP, and mRFP images. (B) to (D) Conventional epifluorescence microscopy after sucrose-induced plasmolysis. Plus signs indicate selected rice protoplasts that contain cytoplasmic fluorescence in the PWL2:FP channel. Merge shows DIC, EGFP, and mRFP (or tdTomato in [B]). (B) PWL2:tdTomato (red), but not BAS4:EGFP (green), was translocated to the cytoplasm of a rice cell invaded by KV106 at 30 HAI. PWL2:tdTomato fluorescence was not observed in adjoining cells. Exposure times were 2 s for both EGFP and tdTomato. (C) PWL2:mRFP (red), but not BAS4:EGFP (green), was translocated to the cytoplasm of rice cells invaded by KV104 at 27 HAI. mRFP fluorescence occurs in the cytoplasm of uninvaded neighbors around regular invaded epidermal cells (bottom right), but not around the invaded vein-associated cell (top left corner). Images presented here, and in (D), were acquired with long exposure times (10 s for EGFP and 6 s for mRFP) for visualization of faint fluorescence in the rice cytoplasm. With reduced exposure times, BAS4:EGFP uniformly outlined IH (see Supplemental Figure 6F online). (D) PWL2:EGFP (green), but not BAS4:mRFP (red), was observed in the cytoplasm of rice cells invaded by KV105 (27 HAI) and in adjoining rice cells. Note that there is some cell wall autofluorescence in both the mRFP and EGFP images. Exposure times were 10 s for EGFP and 6 s for mRFP. (E) BAS1:mRFP (red) was observed in the cytoplasm of cells invaded by KV96, as well as in surrounding cells, here imaged at 36 HAI as described in (B) to (D). Asterisks indicate rice cells with IH and plus signs indicate rice cells without IH. Exposure time for mRFP was 1.5 s. Merge shows DIC and mRFP.
Figure 6.
Figure 6.
Quantitative Analysis of Translocation of PWL2:FP, but Not BAS4:FP, into the Host Cytoplasm. Schematic diagrams illustrate different fluorescence patterns of fusion proteins secreted from IH expressing PWL2:mRFP and BAS4:EGFP (A) (represented here are 301 out of a total of 312 infection sites) and PWL2:EGFP and BAS4:mRFP (B) (represented here are 212 out of a total of 216 infection sites). Rectangles represent rice cells, and ovals represent the plasmolyzed rice protoplast. For PWL2:FP patterns, both the invaded and immediate neighbors were illustrated to indicate cell-to-cell movement of translocated PWL2:FP. For BAS4:FP patterns, only the invaded cell was illustrated. BAS4:FP was not observed in adjoining cells except in a subset of the few cases in which BAS4:FP had apparently reached the host cytoplasm by spillage from damaged EIHM. The shaded red box in (A) and the shaded green box in (B) indicate the successful infection sites with plasmolysis and uniform BAS4-outlining of IH.
Figure 7.
Figure 7.
Nuclear Targeting of PWL2:mCherry Facilitates Visualization of Effector Translocation and Cell-to-Cell Spread. Transformants expressing fluorescently labeled PWL2 and BAS4 proteins in YT16 rice are shown as projections of confocal optical sections taken at 0.45-μm z-intervals over a depth of 21.7 μm (A) or 18.53 μm ([B] and [C]), or as a single-plane confocal image (D). Merge shows bright-field, EGFP, and mCherry. Arrows indicate BICs, arrowheads indicate rice nuclei, and yellow indicates overlapping EGFP and mCherry fluorescence signals. NLS, three tandem repeats of the nuclear localization signal from simian virus large T-antigen; hH1, histone protein H1 of N. crassa. Bars = 10 μm except in inset of (D). (A) and (B) Transformant KV121 expressing PWL2:mCherry:NLS (red) and BAS4:EGFP (green) at 30 HAI. (A) mCherry fluorescence was observed in the primary hyphal tip BIC and in the nucleus of this vein-associated rice cell, but not in adjoining cells. Faint mCherry fluorescence was also seen in an ER-like network inside the invaded rice cell. Pinhole settings were 2 airy units for EGFP and 3 airy units for mCherry. (B) Bright PWL2:mCherry:NLS fluorescence occurred in the nuclei of invaded cells. Lower levels of fluorescence occurred in nuclei of surrounding cells (all 11 in this image). Single-channel images of EGFP or mCherry fluorescence are shown in black and white. Pinhole settings were 1 airy unit for EGFP and 3 airy units for mCherry. The same imaging conditions were used in (C) and in the autofluorescence control (see Supplemental Figure 6C online). (C) Fluorescence from BAS4:mCherry:NLS (red) was not observed in rice nuclei; instead, it outlined the IH together with BAS4:EGFP (green). Transformant KV122 at 30 HAI imaged as described in (B). (D) PWL2:hH1:mCherry (red), but not BAS4:EGFP (green), was observed in the BIC and the nucleus of the cell invaded by KV123 at 28 HAI in this single-plane confocal image obtained with optimal pinhole settings. Note BAS4:EGFP fluorescence outlining the IH and the distinctive green, but not red, fluorescence inside the IH (inset; bar = 2.5 μm), presumably representing BAS4:EGFP in the process of secretion.

Comment in

References

    1. Ai H.-W., Shaner N.C., Cheng Z., Tsien R.Y., Campbell R.E. (2007). Exploration of new chromophore structures leads to the identification of improved blue fluorescent proteins. Biochemistry 46: 5904–5910 - PubMed
    1. Ballini E., Morel J.-B., Droc G., Price A., Courtois B., Notteghem J.-L., Tharreau D. (2008). A genome-wide meta-analysis of rice blast resistance genes and quantitative trait loci provides new insights into partial and complete resistance. Mol. Plant Microbe Interact. 21: 859–868 - PubMed
    1. Berruyer R., Poussier S., Kankanala P., Mosquera G., Valent B. (2006). Quantitative and qualitative influence of inoculation methods on in planta growth of rice blast fungus. Phytopathology 96: 346–355 - PubMed
    1. Bhattacharjee S., Hiller N.L., Liolios K., Win J., Kanneganti T.-D., Young C., Kamoun S., Haldar K. (2006). The malarial host-targeting signal is conserved in the Irish potato famine pathogen. PLoS Pathog. 2: e50. - PMC - PubMed
    1. Bhattacharjee S., van Ooij C., Balu B., Adams J.H., Haldar K. (2008). Maurer's clefts of Plasmodium falciparum are secretory organelles that concentrate virulence protein reporters for delivery to the host erythrocyte. Blood 111: 2418–2426 - PMC - PubMed

Publication types

Substances