. 2010 May;28(5):521-6.
doi: 10.1038/nbt.1632. Epub 2010 May 2.

Dynamic single-cell imaging of direct reprogramming reveals an early specifying event

Affiliations

Dynamic single-cell imaging of direct reprogramming reveals an early specifying event

Zachary D Smith et al. Nat Biotechnol. 2010 May.

Abstract

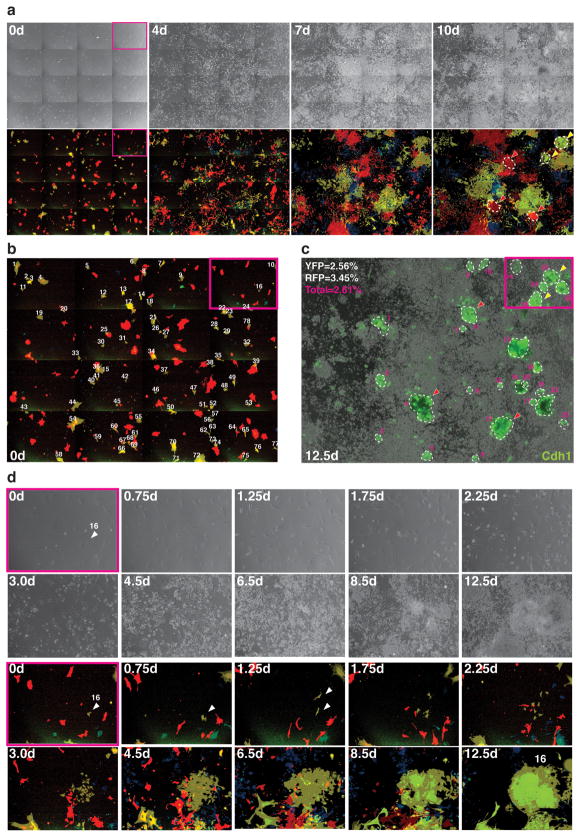
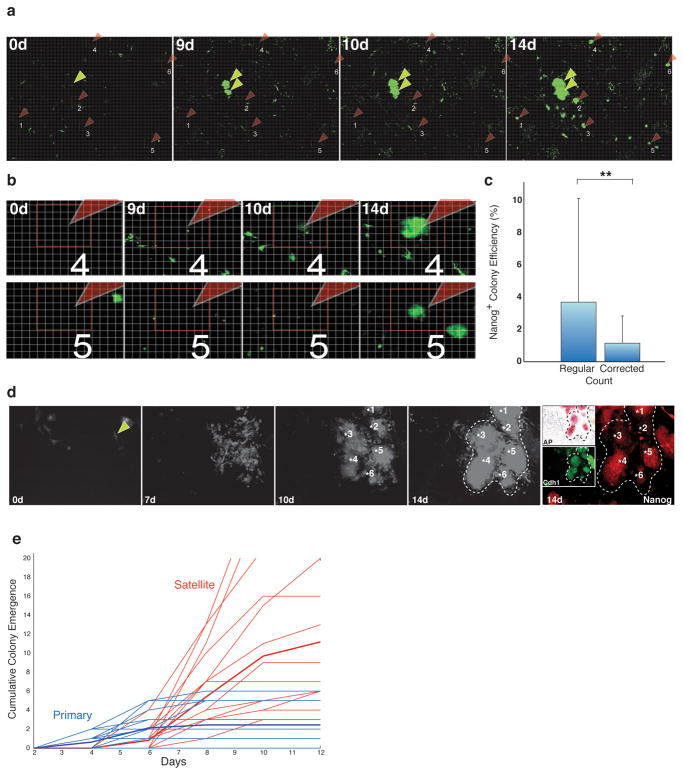
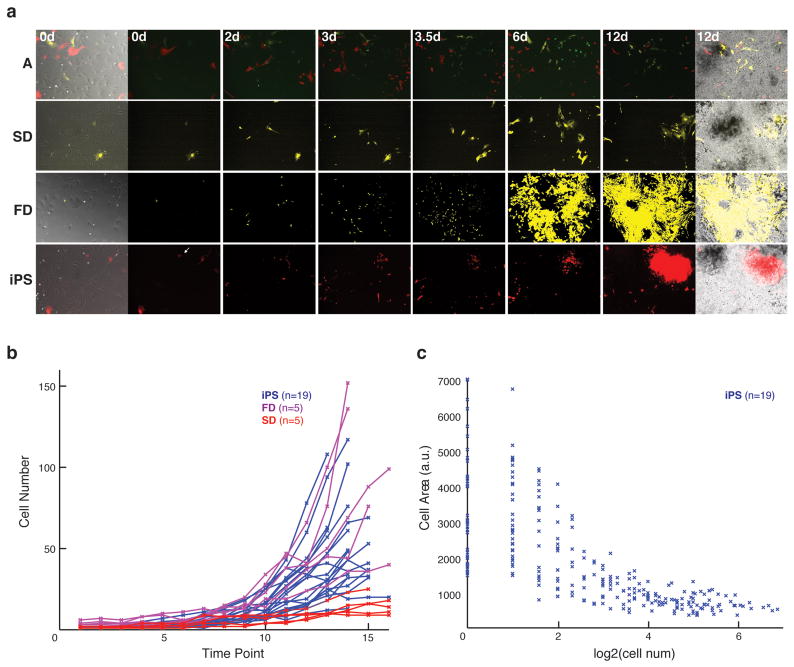
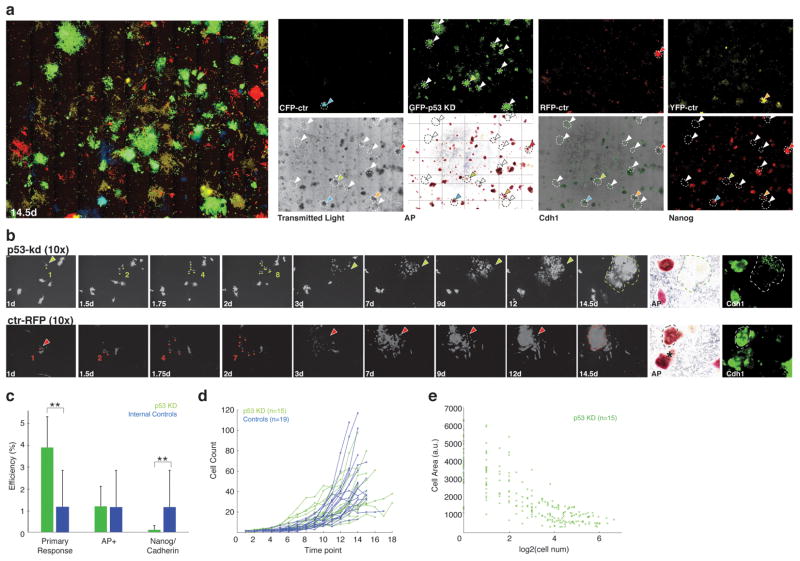
The study of induced pluripotency often relies on experimental approaches that average measurements across a large population of cells, the majority of which do not become pluripotent. Here we used high-resolution, time-lapse imaging to trace the reprogramming process over 2 weeks from single mouse embryonic fibroblasts (MEFs) to pluripotency factor-positive colonies. This enabled us to calculate a normalized cell-of-origin reprogramming efficiency that takes into account only the initial MEFs that respond to form reprogrammed colonies rather than the larger number of final colonies. Furthermore, this retrospective analysis revealed that successfully reprogramming cells undergo a rapid shift in their proliferative rate that coincides with a reduction in cellular area. This event occurs as early as the first cell division and with similar kinetics in all cells that form induced pluripotent stem (iPS) cell colonies. These data contribute to the theoretical modeling of reprogramming and suggest that certain parts of the reprogramming process follow defined rather than stochastic steps.


Figures

Figure 1
Figure 1. Continuous single cell imaging allows tracking of reprogramming cells
a) Tracking of uniquely labeled inducible fibroblast populations over a reprogramming time series. Selected images are displayed as a global 4x4 field in phase contrast (Upper Panel) and with respective wavelengths highlighted (Lower Panel). All images are at 10× magnification. b) 4×4 multi-wavelength overlay at t=0 days. These images were used to accurately count the seeded (and attached) number of starting MEFs for direct assessment of reprogramming efficiency of equivalently induced populations. Cells of a given wavelength (here YFP, n=78) within the tracked field were enumerated for downstream analysis. c) Terminal (day 12.5) E-Cadherin (Cdh1) immunostaining demarcates successfully reprogrammed colonies and demonstrates the equitable distribution of colony forming events across analyzed wavelengths and for the population as a whole. Yellow arrowheads mark colonies that originated from unique YFP labeled MEFs. Red arrowheads mark colonies that originated from RFP labeled MEFs. Magenta numbers indicate colonies (circled with dashed line) that were counted. Efficiencies provided are based on the number of marker positive colonies divided by the number of MEFs counted in b (YFP and RFP) or the total number (including unlabeled) seeded. d) Progression of single fibroblast to an iPS cell colony over 12.5 days in phase contrast (Upper Panel) and with respective wavelengths highlighted (Lower Panel). Colonies were identified at the terminal time point and retrospectively traced to their founding fibroblast. Tracking of a single cell through the complete time series allows for comparative morphological characterization of cells that do reprogram against those that do not. Here, a reprogramming lineage beginning with a single YFP labeled fibroblast (#16 shown in Fig 1b, magenta square) is traced to the resulting iPS colony (see Supplementary Movie 1).
Figure 2
Figure 2. Progressive accumulation of secondary, non-unique “satellite” colonies skew interpretation of reprogramming data
a) GFP labeled satellite colonies without unique origins over a global 5x5 field in 10x magnification. Satellite colonies (a subset highlighted with red arrowheads; see Supplementary Fig. 5 for more images) typically become macroscopically visible after day 6 and clearly and the formation of primary colonies (yellow arrowheads) without a traceable origin (see Supplementary Movie 2). A grid (light grey) and squares (red) were added to the image to help orientation and facilitate comparison. b) Zoom-in view of two satellite colonies (satellite # 4 and #5). For colony #4 it is clearly visible between day 9 and 10, that all cells are accounted for, but that a new cluster of cells (arrowhead) has appeared within 24h. Note the small green dot that has not moved. Similarly, below it is apparent that neither of the two colonies present in the day 14 image originated from any cell in this field. The entire imaged area and additional colonies can be inspected in Supplementary Fig. 4. c) Corrected efficiencies accounting for colonies in which a unique cell of origin status can be assigned, and removing all apparent secondary events, compared to un-corrected efficiencies. Mean of all analyzed (n=40) experiments is shown. The efficiency distributions are significantly different (p=0.00034, paired t-test). d) A single YFP labeled inducible MEF (asterisk) exhibits the potential to contribute multiple (at least 6) colony forming events before cells demonstrate an iPS cell morphology, suggesting that the ability to reprogram is specified in early precursors and distributed to multiple progeny (see Supplementary Movie 3). e) Cumulative primary and satellite colonies per well analyzed (n=16). Primary colonies arise during the first 4–8 days after which the number stabilizes. Satellites were scored at day 14 and traced to the earliest time (typically between day 6–12) in which a founding cell could be identified. Thin lines represent individual experiments. Bold line indicates the mean over all experiments.
Figure 3
Figure 3. Unique fates of induced fibroblasts reveal a conserved trajectory for reprogramming cells
a) Representation of unique cell fates in response to factor induction. From top to bottom: Apoptotic/Arrested (A), Slow Dividing (SD), Fast Dividing Fibroblast (FD) and (iPS) cell morphologies at t=0 days and across representative time points during the reprogramming process (see Supplementary Movies 4a-d). The left and right images are transmitted, multi- or single- wavelength overlays. Center images show only the different wavelength images. Time is indicated in days. Images are 10×. b) Cell number over the first 4 days of the reprogramming timeline (time point= 0.25 days); lines represent the median for lineages of non-reprogramming cell types (FD, magenta, n=5; SD, red, n= 5) and cells that will form iPS cell colonies (iPS, blue, n=19) c) Cellular area (in arbitrary units/pixels) as mapped over division number within iPS cell forming lineages (n=19). A stable ES/iPS like cell size is reached within 2–4 divisions.
Figure 4
Figure 4. Effects of p53 knockdown on single cells during the reprogramming process
a) A revised imaging experiment in which control cells were tagged as before with YFP, CFP or RFP. The control GFP vector was replaced with a p53-shRNA containing GFP vector . Induction and acquisition were done as before. Left: Multi-wavelength overlay shows the notable increase in GFP colonies. Right: p53 depleted cells (tagged with GFP) exhibit an increased number of colony-like morphologies that display only minimal activation of endogenous pluripotency factors. Most of the GFP colonies cannot be matched to an AP, Cdh1 or Nanog positive colony. Note: The transmitted light and the marker stains show all colonies (including unlabeled controls which represent the majority; white arrows: factor negative colonies; colored arrows: factor positive colonies). Colonies are circled with dashed lines to facilitate mapping across images. b) Selected images of the progression for a single p53 depleted cell (upper panel) and a control cell (tagged with RFP, bottom panel). Both exhibit similar enhanced proliferation and morphological characteristics at early time points but result in disparate fates (Supplementary Movie 5). Last panels on the right show AP and Cdh1 staining. c) Formation of primary colonies, AP positivity, and Nanog/Cadherin signal for p53 depleted cells compared to alternatively labeled controls (p-values 0.00004, 0.4 and 0.01, respectively, paired Kolmogorov-Smirnof test) as calculated by events over starting population. Means over 8 wells are shown. d) The proliferative characteristics of reprogramming p53 knockdown cells are comparable to reprogramming controls over the first 4 days. e) p53 knockdown cells exhibit size reduction dynamics that are also similar to those for normally reprogramming cells within the first 4 divisions.

Comment in

  • Regen Med. 2010 Jul;5(4):501-3

References

    1. Takahashi K, Yamanaka S. Induction of pluripotent stem cells from mouse embryonic and adult fibroblast cultures by defined factors. Cell. 2006;126:663–676. - PubMed
    1. Nakagawa M, et al. Generation of induced pluripotent stem cells without Myc from mouse and human fibroblasts. Nat Biotechnol. 2008;26:101–106. - PubMed
    1. Wernig M, Meissner A, Cassady JP, Jaenisch R. C-Myc is dispensable for direct reprogramming of mouse fibroblasts. Cell stem cell. 2007 - PubMed
    1. Yu J, et al. Induced pluripotent stem cell lines derived from human somatic cells. Science. 2007;318:1917–1920. - PubMed
    1. Feng B, et al. Reprogramming of fibroblasts into induced pluripotent stem cells with orphan nuclear receptor Esrrb. Nat Cell Biol. 2009;11:197–203. - PubMed

Publication types

Substances

Associated data