. 2010 Jun;12(6):553-562.
doi: 10.1038/ncb2057. Epub 2010 May 2.

MTCH2/MIMP is a major facilitator of tBID recruitment to mitochondria

Affiliations

MTCH2/MIMP is a major facilitator of tBID recruitment to mitochondria

Yehudit Zaltsman et al. Nat Cell Biol. 2010 Jun.

Abstract

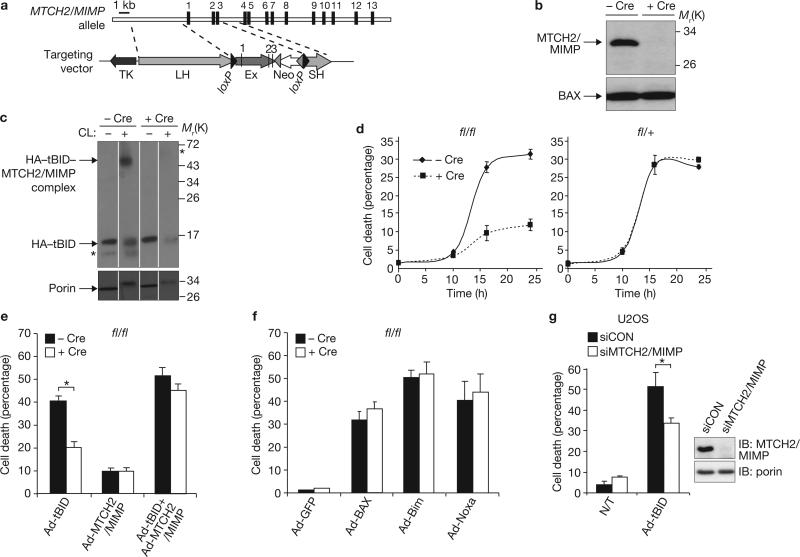
The BH3-only BID protein (BH3-interacting domain death agonist) has a critical function in the death-receptor pathway in the liver by triggering mitochondrial outer membrane permeabilization (MOMP). Here we show that MTCH2/MIMP (mitochondrial carrier homologue 2/Met-induced mitochondrial protein), a novel truncated BID (tBID)-interacting protein, is a surface-exposed outer mitochondrial membrane protein that facilitates the recruitment of tBID to mitochondria. Knockout of MTCH2/MIMP in embryonic stem cells and in mouse embryonic fibroblasts hinders the recruitment of tBID to mitochondria, the activation of Bax/Bak, MOMP, and apoptosis. Moreover, conditional knockout of MTCH2/MIMP in the liver decreases the sensitivity of mice to Fas-induced hepatocellular apoptosis and prevents the recruitment of tBID to liver mitochondria both in vivo and in vitro. In contrast, MTCH2/MIMP deletion had no effect on apoptosis induced by other pro-apoptotic Bcl-2 family members and no detectable effect on the outer membrane lipid composition. These loss-of-function models indicate that MTCH2/MIMP has a critical function in liver apoptosis by regulating the recruitment of tBID to mitochondria.


Figures

Figure 1
Figure 1
MTCH2/MIMP is an outer mitochondrial membrane protein. (a) MTCH2/MIMP is exposed on the surface of mitochondria. Mouse liver mitochondria were either left untreated (−) or treated with a low (0.1 μg ml−1; +) or a high (1 μg ml−1; ++) concentration of proteinase K (Prot K), lysed, size-fractionated by SDS–PAGE and analysed by western blotting with anti-MTCH2/MIMP antibodies (left panel), anti-AIF antibodies (middle panel) or anti-ANT antibodies (right panel). IMS, intermembrane space. (b) MTCH2/MIMP is enriched in the OMM. Submitochondrial membrane vesicles were prepared from rat liver mitochondria, lysed, size-fractionated by SDS–PAGE and analysed by western blotting with anti-cytochrome c oxidase subunit IV (Cyt Oxi) antibodies, anti-ANT antibodies, anti-TOM20 antibodies and anti-MTCH2/MIMP antibodies. OMM, low-density fractions enriched in outer-membrane vesicles; IMM, high-density fractions enriched in inner-membrane vesicles. (c) MTCH2/MIMP is degraded by trypsin after import into yeast mitochondria. Radiolabelled MTCH2/MIMP was imported into purified wild-type yeast mitochondria for 30 min at 30 °C in the presence or absence of a membrane potential (ΔΨm). Non-imported precursor was removed by treatment with protease, and the imported proteins were resolved by 15% SDS–PAGE and detected by autoradiography. Also included were 5% input standards (STD) of MTCH2/MIMP and Su9-DHFR. For Su9-DHFR, the locations of precursor (p) and imported mature (m) protein are indicated. (d) MTCH2/MIMP is a membrane-associated protein. Radiolabelled MTCH2/MIMP and AAC were imported into purified wild-type yeast mitochondria for 30 min at 30 °C in the presence of membrane potential (ΔΨm). After import, the samples were extracted with carbonate at the indicated pH values. The supernatants were precipitated with trichloroacetic acid. Total (T), pellets (P) and supernatants (S) were resolved by 13% SDS–PAGE and detected by autoradiography. Uncropped images of blots are shown in Supplementary Information, Fig. S8.
Figure 2
Figure 2
Loss of MTCH2/MIMP in ES cells decreases the sensitivity to tBID-induced MOMP. (a) The MTCH2/MIMP gene spans about 23 kilobases (kb) on chromosome 2 and consists of 13 exons. In the targeted allele, the first three exons were replaced by a neomycin (Neo)-resistant cassette, thereby creating a functional null allele. Also indicated are the short homology (SH) and long homology (LH) regions, the thymidine kinase (TK) negative selection cassette, restriction enzyme sites (NcoI and SpeI) and the positions of external probes. (b) Generation of MTCH2/MIMP−/− ES stable lines. Left: wild-type and MTCH2/MIMP−/− E3.5 blastocytes were lysed, subjected to SDS–PAGE and western blot analysed with anti-MTCH2/MIMP antibodies. Right: the MTCH2/MIMP knockout ES cells were transfected with either an empty pcDNA3.1 vector (KO) or a pcDNA3.1 vector carrying MTCH2/MIMP-MH (R). Cells from four single stable clones (KO1, KO2, R1 and R2 clones) were lysed and analysed as above. Porin was used as an internal standard. (c) R cells are more sensitive than KO cells to tBID-induced mitochondrial depolarization. Presented are tetramethylrhodamine ethyl ester fluorescence (excitation wavelength 545 nm, emission wavelength 580 nm) recordings of KO1 (black) and R1 (red) clones treated with 0, 1 and 40 nM recombinant tBID. The actual raw data from a representative experiment appears in the top panel, and the data in the bottom panel represent the means and s.e.m. for three independent recordings. (d) R cells are more sensitive than KO cells to tBID-induced cytochrome c release. At the end of the recordings in c, the suspensions of the KO1 and R1 clones were centrifuged and the supernatants were subjected to SDS–PAGE, followed by western blot analysis with anti-cytochrome c antibodies. Actin was used as an internal standard. rectBID, recombinant tBID. (e) Bak is homodimerized in the R cells at the low concentration of tBID. KO1 and R1 clones were treated as in c, and after centrifugation the pellet fractions were treated with the crosslinker 1,6-bismaleimidohexane (BMH), lysed and western blot analysed with anti-Bak antibodies. Porin was used as an internal standard. Similar results were obtained with the two additional pairs of KO and R clones. Uncropped images of blots are shown in Supplementary Information, Fig. S8.
Figure 3
Figure 3
Conditional knockout of MTCH2/MIMP in MEFs decreases the sensitivity to tBID-induced apoptosis. (a) Generation of the MTCH2/MIMP conditional targeting vector. Indicated are loxP sites (black triangles), Frt sites (grey triangles), the neomycin (Neo) positive selection cassette, and the thymidine kinase (TK) negative selection cassette. (b) Conditional deletion of MTCH2/MIMP in MEFs. MTCH2/MIMPfl/fl MEFs in the absence or presence of Cre recombinase were lysed, and the mitochondria-enriched fractions were western blot analysed for MTCH2/MIMP. Bax was used as an internal standard. (c) The tBID crosslinked complex is not generated in MTCH2/MIMP-deficient MEFs. MTCH2/MIMPfl/fl MEFs were treated as in b, infected with Ad-tBID, and the mitochondria-enriched fractions were treated in the absence or presence of the crosslinker bis(2-(sulfosuccinimidooxy-carbonyloxy)ethyl)sulphone (BSOCOES) followed by western blotting analysis. CL, crosslinker. Asterisks mark crossreactive bands. Porin was used as an internal standard (bottom panel) and all samples were run on the same gel. (d) MTCH2/MIMP-deficient MEFs are less sensitive to Ad-tBID-induced apoptosis. MTCH2/MIMPfl/fl (fl/fl; left panel) and MTCH2/MIMPfl/+ (fl/+; right panel) MEFs in the absence or presence of Cre recombinase were infected with Ad-tBID and cell death was monitored by propidium iodide dye exclusion. Data are means and s.d. for three independent experiments. (e) The reduced susceptibility of MTCH2/MIMP-deficient MEFs to Ad-tBID is due to the absence of MTCH2/MIMP. fl/fl MEFs in the absence or presence of Cre recombinase were infected with the indicated adenoviruses, and cell death was monitored as above. Data are the means and s.d. for three independent experiments; asterisk, P < 0.00005. (f) MTCH2/MIMP deletion has no effect on apoptosis induced by other pro-apoptotic Bcl-2 family members. fl/fl MEFs in the absence or presence of Cre recombinase were infected with the indicated adenoviruses, and cell death was monitored as above. Data are means and s.d. for three independent experiments. GFP, green fluorescent protein. (g) Knocking down MTCH2/MIMP in U2OS cells decreases the sensitivity to Ad-tBID. MTCH2/MIMP was knocked down in U2OS cells as described in Methods, and cells were either left untreated (N/T) or infected with Ad-tBID and cell death was monitored as above. Data are the means and s.d. for three independent experiments; asterisk, P < 0.005. Uncropped images of blots are shown in Supplementary Information, Fig. S8.
Figure 4
Figure 4
Conditional knockout of MTCH2/MIMP in MEFs hinders the recruitment of tBID to mitochondria. (a) MTCH2/MIMP-deficient MEFs are less sensitive to apoptosis induced by DNA-damaging reagents. fl/fl and fl/+ MEFs in the absence or presence of Cre recombinase were treated with each of the indicated apoptotic stimuli for 14 h: Fas (1 ng ml−1) and cycloheximide (CHX; 1 μg ml−1), etoposide (Etop; 100 μM), and cisplatin (Cis; 33 μM). Cell death was monitored as above. Data are means and s.d. for three independent experiments; asterisk, P < 0.0005. (b) Deletion of MTCH2/MIMP hinders the recruitment of tBID to mitochondria. fl/fl MEFs in the absence or presence of Cre recombinase were either infected with Ad-tBID, treated with etoposide (100 μM; 8 h) or treated with Fas (5 ng ml−1) and cycloheximide (CHX; 1 μg ml−1; 6 h). Cells were then lysed, and the mitochondria-enriched fractions, the cytosolic fractions and total cell lysates were western blot analysed with anti-HA (top left panel) or anti-BID (all other panels) antibodies. Asterisks mark crossreactive bands. Porin and actin were used as internal standards. (c) Deletion of MTCH2/MIMP decreases the levels of N-terminal exposed/activated Bax. fl/fl MEFs were treated as in b and lysed, and the mitochondria-enriched fractions were treated with trypsin as described in Methods, followed by western blot analysis. The middle panel shows a short exposure of the blot shown in the top panel. Porin was used as an internal standard. (d) Deletion of MTCH2/MIMP reduces cytochrome c release. fl/ fl MEFs in the absence or presence of Cre recombinase were treated with the indicated death stimuli. Cells were then fixed and immunostained for cytochrome c, and the percentage of cells with cytochrome c released was quantified. Data are means and s.d. for three independent experiments. About 300 cells of each treatment were analysed. Asterisk, P < 0.05; two asterisks, P < 0.01. (e) fl/fl MEFs are type I cells. fl/fl MEFs were either infected or not with Ad-Bcl-2 and then treated with the indicated death stimuli for 14 h: Fas and cycloheximide (as in a), and etoposide (10 μM). Cell death was monitored as in a. Data are means and s.d. for three independent experiments; asterisk, P < 0.005. Uncropped images of blots are shown in Supplementary Information, Fig. S8.
Figure 5
Figure 5
MTCH2/MIMP deletion in the liver decreases the sensitivity of mice to Fas-induced hepatocellular apoptosis and hinders the recruitment of tBID to mitochondria. (a) Western blot analysis of MTCH2/MIMP in liver lysates demonstrates its absence in livers prepared from MTCH2/MIMPfl/Δ;Alb-Cre (fl/Δ) mice. Bcl-XL was used as an internal standard (bottom panel). The asterisk marks a crossreactive band. (b) Conditional knockout of MTCH2/MIMP in the liver significantly decreases the sensitivity of mice to Fas-induced hepatocellular apoptosis. Left: Kaplan–Meier survival curves of MTCH2/MIMPfl/+;Alb-Cre mice (fl/+; n = 15) and MTCH2/MIMPfl;Alb-Cre mice (fl/Δ; n = 14) in response to a single intraperitoneal injection of 0.55 μg g−1 anti-Fas antibody (Jo2; Pharmingen). The Kaplan–Meier survival curves were compared by using the long-rank test and were found statistically different from each other (P < 0.05). Right: haematoxylin/eosin staining of paraffin-embedded liver sections from a fl/+ mouse (top) and a fl/Δ mouse (bottom) 4 h after injection of anti-Fas antibody. Note the condensed and fragmented nuclei and the haemorrhage in the fl/+ liver. Scale bars, 50 μM. (c) A significant decrease in caspase-3 activation in fl/Δ liver cytosolic fractions in response to anti-Fas antibody. fl/+ and fl/Δ mice (four of each) were either left untreated (−) or injected with anti-Fas antibodies for the indicated durations. After treatment, S100 fractions (the supernatant resulting from 100,000g centrifugation of cytosolic fractions) were prepared from all eight livers and analysed by western blotting for caspase-8 cleavage/activation (top panel; p18 represents the activated protease), BID cleavage/activation (middle panel), and caspase-3 (Casp-3) activity with the fluorogenic peptide substrate DEVD-AMC (bottom panel; the results are presented in arbitrary units (AU) as means and s.d. for three independent experiments; asterisk, P < 0.02; two asterisks, P < 0.01). Actin was used in both blots as an internal standard. IB, immunoblot. (d) A significant decrease in tBID recruitment to mitochondria and Bax activation in fl/Δ liver mitochondrial fractions in response to anti-Fas antibody. Top: liver mitochondrial fractions prepared from the mice described in c were lysed, and western blot analysed with anti-BID antibodies. Bottom: liver mitochondrial fractions treated with trypsin, lysed, and western blot analysed with anti-Bax antibodies. Porin was used in both blots as an internal standard. Uncropped images of blots are shown in Supplementary Information, Fig. S8.
Figure 6
Figure 6
MTCH2/MIMP deletion in the liver prevents the in vitro import of tBID. Kinetics of HA–tBID import into mitochondria (a) and cytochrome c release (b). Cytosolic fractions of 293T cells expressing HA–tBID and depleted of cytochrome c (using anti-cytochrome c antibodies) were incubated with purified, intact mitochondria isolated from mouse liver prepared from either fl/+ mice (top panels) or fl/Δ mice (bottom panels). At the indicated time points, mitochondria were separated from the soluble fraction by centrifugation, and both fractions were lysed and analysed by western blotting with anti-HA (a) or anti-cytochrome c (b) antibodies. Actin and porin were used as internal standards for the soluble and cytosolic fractions and the mitochondrial fraction, respectively. Uncropped images of blots are shown in Supplementary Information, Fig. S8.
Figure 7
Figure 7
MTCH2/MIMP deletion in the liver has no effect on the levels of CL in whole mitochondria and the OMM. (a) CL spectra of liver mitochondria. CL spectra were acquired by HPLC mass spectrometry in whole mitochondria prepared from livers of fl/+ and fl/Δ mice. Three major clusters of CLs (C70, C72 and C74) are shown, where the cluster designated C72 contains the major CL tetralinoleoylcardiolipin (C7x corresponds to the number of carbon atoms in the four acyl side chains of the molecule). Tetramyristoylcardiolipin (C56 = IS) was used as internal standard. The almost identical abundances of the different clusters and the distribution of the peaks within the clusters implies that the acyl composition is not different in fl/+ and fl/Δ mice. m/z, mass to charge ratio. (b) Purification of OMM from liver mitochondria. Samples from the purified mitochondria (Mito), and outer-membrane fraction (OMM) were lysed, size-fractionated by SDS–PAGE and analysed by western blotting with anti-TOM20 antibodies, anti-MTCH2/MIMP antibodies and anti-cytochrome c oxidase subunit IV (Cyt Oxi) antibodies. (c) CL levels and spectra of OMM fractions from liver. CL levels and spectra were determined by HPLC mass spectrometry in enriched OMM fractions prepared from livers of fl/+ and fl/Δ mice either left untreated or injected with 0.55 μg g−1 anti-Fas antibody (+Fas; 2 h). Left panel: as for whole mitochondria in a, the abundances of the different CL clusters and the distributions of the peaks within the clusters show no differences when comparing fl/+ and fl/Δ mice. Right panel: data are means and s.d. for three independent experiments.

References

    1. Danial NN, Korsmeyer SJ. Cell death: critical control points. Cell. 2004;116:205–219. - PubMed
    1. Youle RJ, Strasser A. The BCL-2 protein family: opposing activities that mediate cell death. Nature Rev. Mol. Cell Biol. 2008;9:47–59. - PubMed
    1. Wang X. The expanding role of mitochondria in apoptosis. Genes Dev. 2001;15:2922–2933. - PubMed
    1. Kroemer G, Galluzzi L, Brenner C. Mitochondrial membrane permeabilization in cell death. Physiol. Rev. 2007;87:99–163. - PubMed
    1. Chipuk JE, Green DR. How do BCL-2 proteins induce mitochondrial outer membrane permeabilization? Trends Cell Biol. 2008;18:157–164. - PMC - PubMed

Publication types

MeSH terms

Substances