. 2010 Jun;13(6):739-44.
doi: 10.1038/nn.2538. Epub 2010 May 2.

Sublayer-specific microcircuits of corticospinal and corticostriatal neurons in motor cortex

Affiliations

Sublayer-specific microcircuits of corticospinal and corticostriatal neurons in motor cortex

Charles T Anderson et al. Nat Neurosci. 2010 Jun.

Abstract

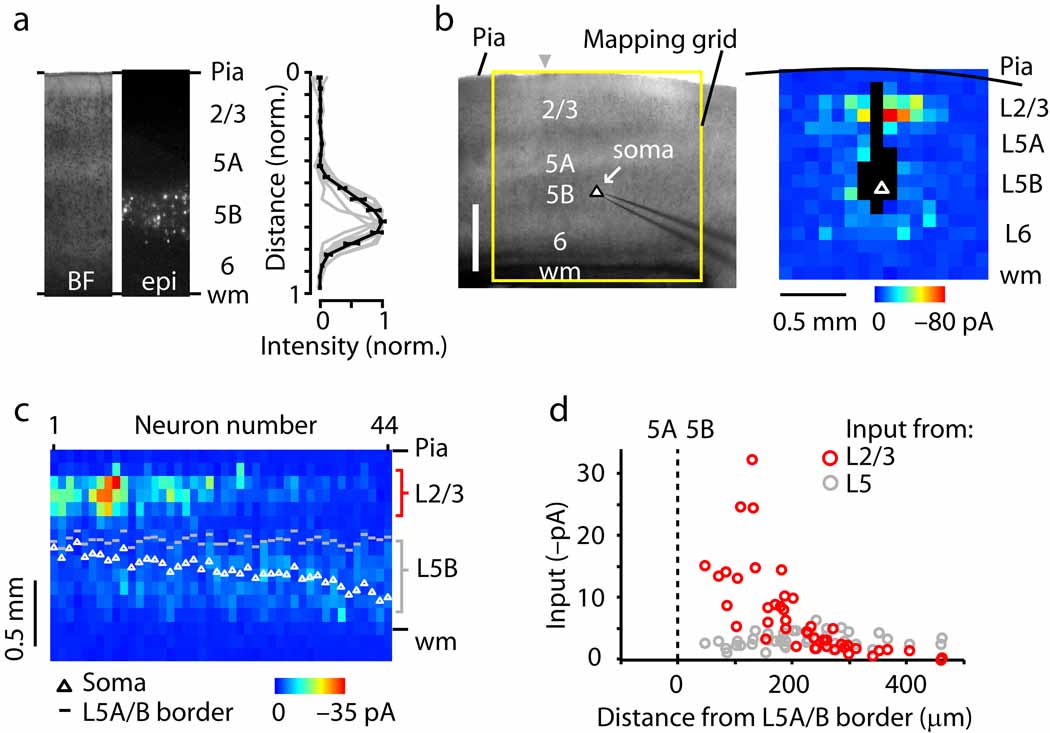
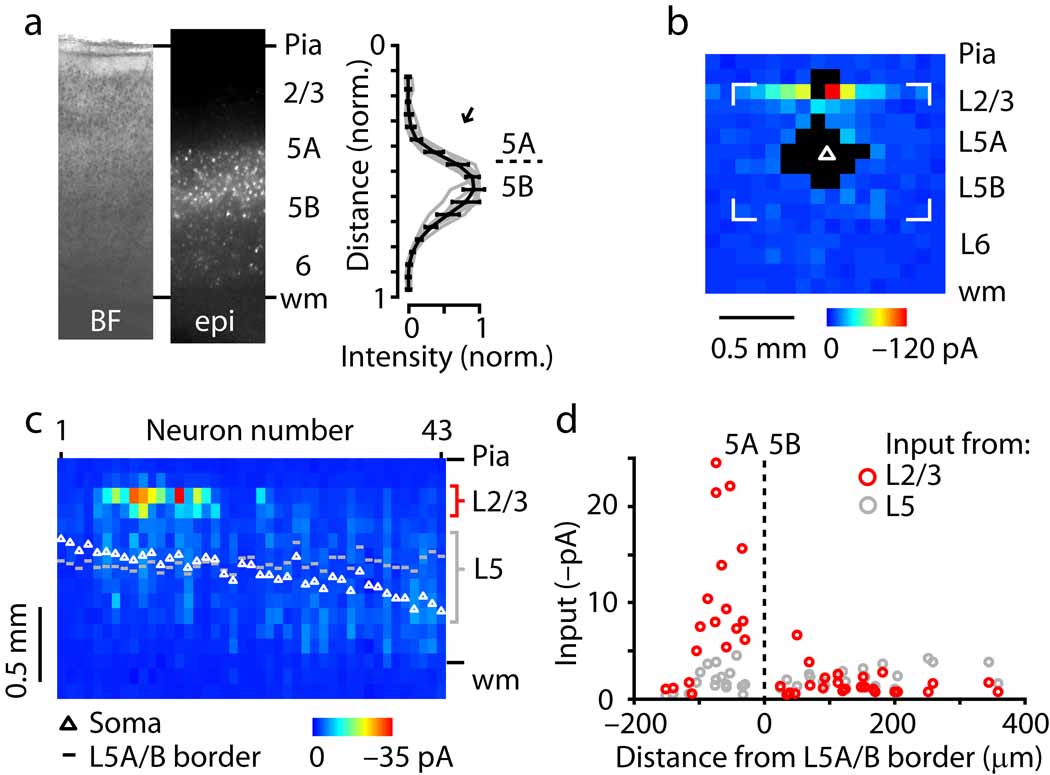
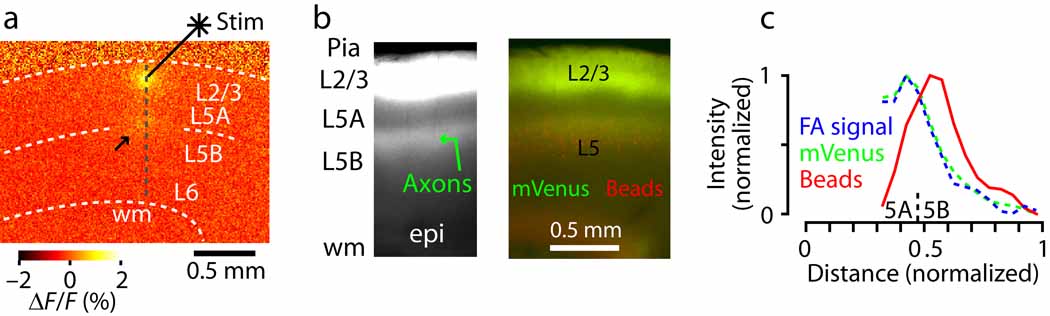
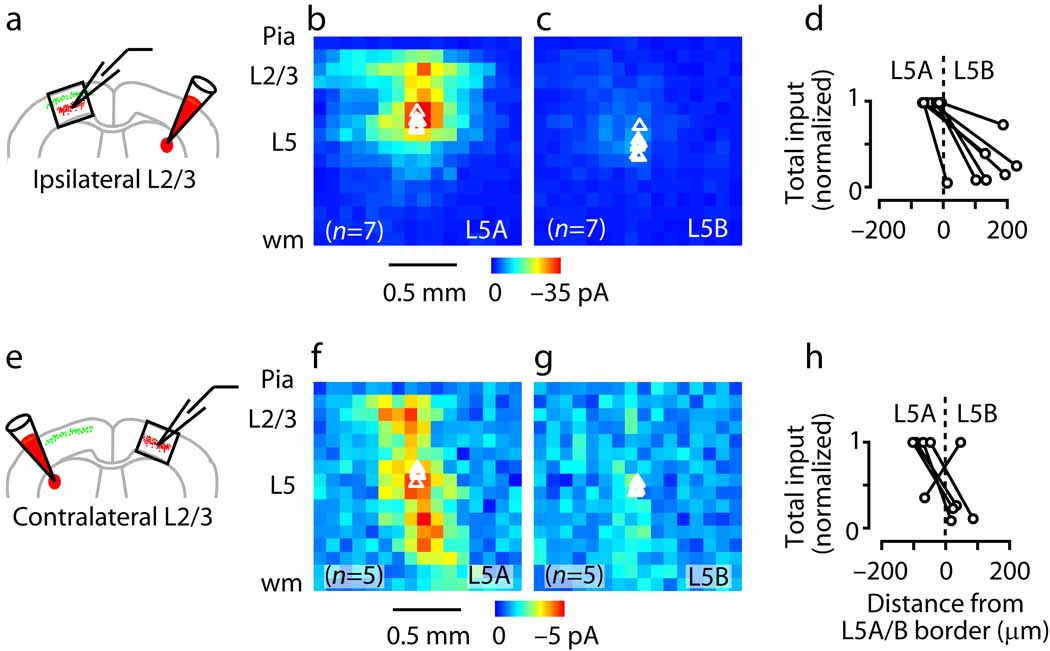
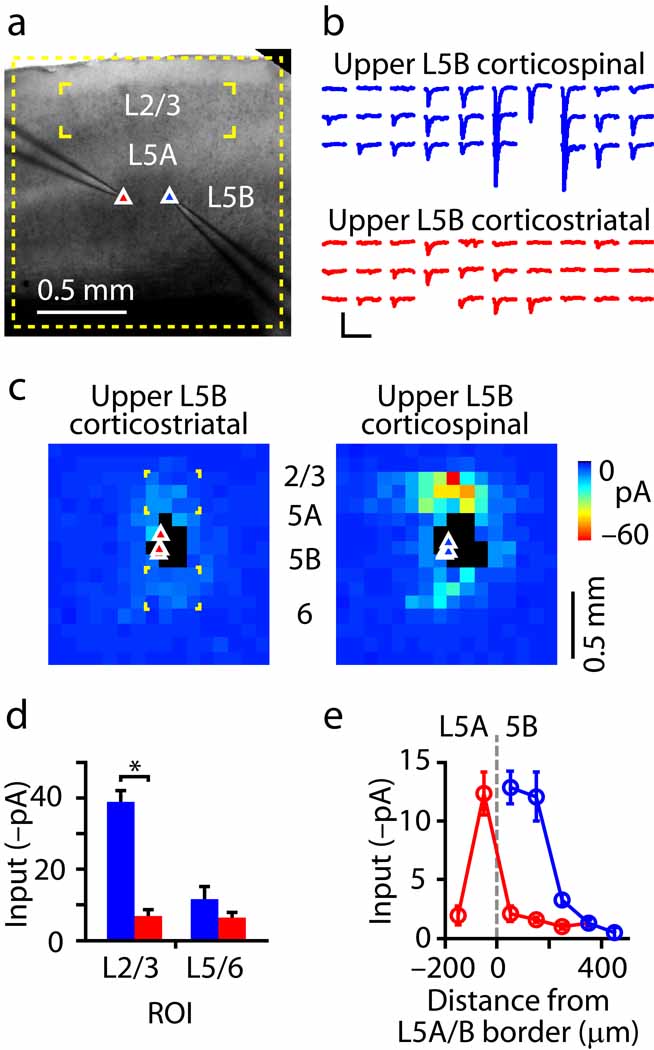
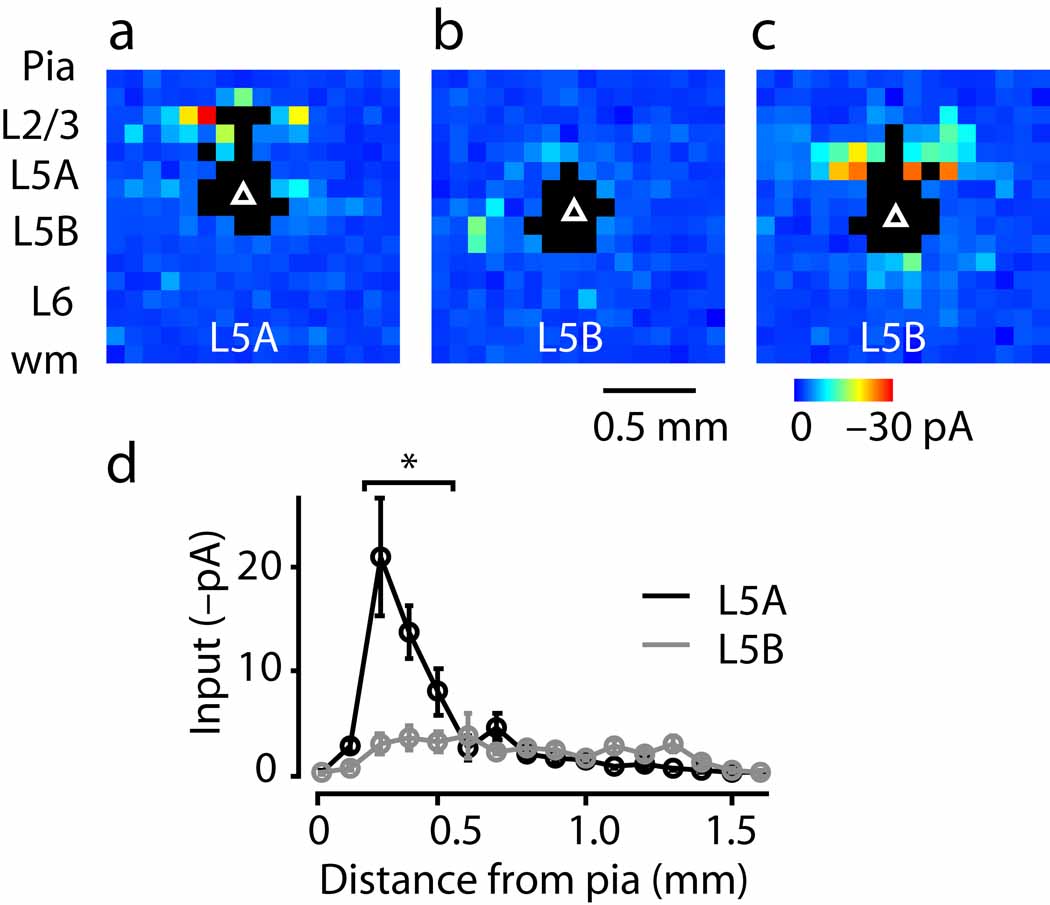
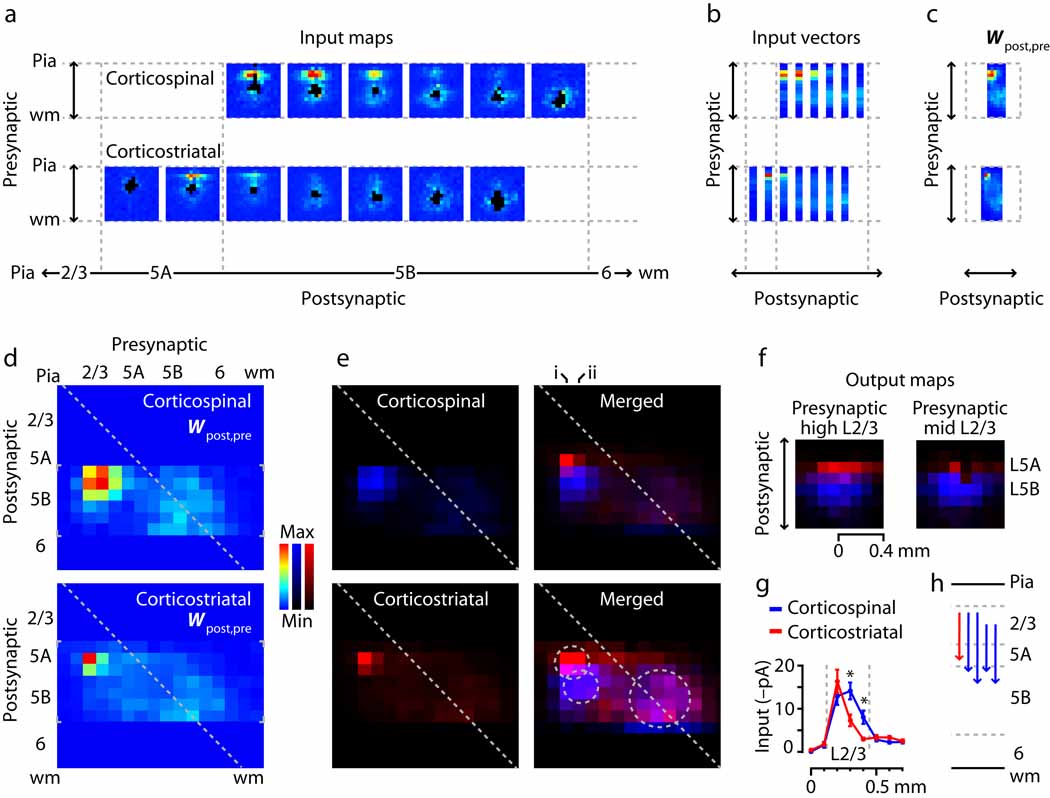
The mammalian motor system is organized around distinct subcortical subsystems, suggesting that the intracortical circuits immediately upstream of spinal cord and basal ganglia might be functionally differentiated as well. We found that the main excitatory pathway in mouse motor cortex, layer 2/3-->5, is fractionated into distinct pathways targeting corticospinal and corticostriatal neurons, which are involved in motor control. However, connections were selective for neurons in certain sublayers: corticospinal neurons in upper layer 5B and corticostriatal neurons in lower 5A. A simple structural combinatorial principle accounts for this highly specific functional circuit architecture: potential connectivity is established by neuronal sublayer positioning and actual connectivity in this framework is determined by long-range axonal projection targets. Thus, intracortical circuits of these pyramidal neurons are specified not only by their long-range axonal targets or their layer or sublayer positions, but by both, in specific combinations.


Figures

Fig. 1
Fig. 1
Sub-layer specific circuits of corticospinal projection neurons. (a) Fluorescently labeled corticospinal neurons are distributed across layer 5B in motor cortex. Left, bright-field (BF) and epifluorescence (epi) images; right, normalized fluorescence intensity as a function of normalized cortical distance, where pia = 0 and white matter (wm) = 1. (b) Example of a synaptic input map recorded from a corticospinal neuron. (c) ‘Side view’ of group of input maps (n = 44 corticospinal neurons). Maps were sorted by soma distance from the layer 5A/B border, and the collection of maps was projected onto one plane by averaging along map rows. The absolute distances from the pia to the soma (white circles) and to the layer 5A/B border (gray dashes) are also plotted. (d) Layer 2/3 (red) and 5 (gray) input as a function of the distance of the soma from the layer 5A/B border, along the radial axis of the cortex (pia is leftward and white matter is rightward).
Fig. 2
Fig. 2
Sub-layer specific circuits of crossed corticostriatal projection neurons. (a) Laminar distribution of fluorescently labeled neurons. (b) Example of corticostriatal neuron input map. (c) Side view of group of input maps (n = 43 corticostriatal neurons). (d) Layer 2/3 (red) and 5 (gray) input as a function of the distance of the soma from the layer 5A/B border, along the radial axis of the cortex (pia is leftward and white matter is rightward).
Fig. 3
Fig. 3
Layer 2/3→5 pathways project to the layer 5AB border. (a) Flavoprotein autofluorescence (FA) imaging of activity evoked by focal glutamate photostimulation in layer 2/3. Arrow, hotspot of activity at layer 5A/B border. (b) Layer 2/3 neurons expressing fluorescent proteins. Arrow, plexus of fluorescently labeled axons of layer 2/3 neurons, concentrated at layer 5A/B border. (c) Comparison of the average laminar profiles of the activity evoked by layer 2/3 stimulation (FA; n = 6 slices), the fluorescently labeled layer 2/3 axonal projection to layer 5 (mVenus; n = 5 slices), and retrogradely labeled corticostriatal neurons (beads; n = 7 slices).
Fig. 4
Fig. 4
CRACM analysis of the sub-layer specificity of circuits within the class of crossed corticostriatal neurons, showing that layer 2/3 axons provide input to layer 5A but not layer 5B corticostriatal neurons. (a) CRACM analysis of ipsilateral layer 2/3 projections to corticostriatal neurons. Schematic depicts double-labeling paradigm for examining ipsilateral (local) layer 2/3 inputs to crossed corticostriatal neurons. (b) Average ipsilateral layer 2/3 input to layer 5A corticostriatal neurons. (c) Average ipsilateral input for layer 5B corticostriatal neurons (same color scale). (d) Total ipsilateral input as a function of distance from layer 5A/B border. Recordings were paired (i.e., one layer 5A and one layer 5B neuron) and values normalized to the higher value of the pair. (e) CRACM analysis of contralateral (callosal) layer 2/3 projections to crossed corticostriatal neurons. (f) Average callosal layer 2/3 input to layer 5A corticostriatal neurons. (g) Average contralateral input to layer 5B corticostriatal neurons (same color scale). (h) Total contralateral input as a function of distance from the layer 5A/B border.
Fig. 5
Fig. 5
Pair-mapping analysis of the projection-class specificity of circuits within the same sub-layer, showing that layer 2/3 axons avoid layer 5B corticostriatal neurons, in favor of corticospinal neurons. (a) Recording arrangement for simultaneous mapping of layer 2/3 input to a pair of layer 5B corticostriatal (left) and corticospinal (right) neurons. (b) Responses across the array of layer 2/3 stimulation sites simultaneously recorded in a corticostriatal (red) and corticospinal (blue) neuron. (c) Average maps for (sequentially recorded) corticospinal/corticostriatal pairs, showing lack of layer 2/3 input to corticostriatal neurons. (d) Mean input from layer 2/3 to layer 5B neurons as a function of projection class (blue: corticospinal; red: corticostriatal). ROIs used for this analysis are indicated in panel c (bracketed regions on the map on the left). (e) Binned (bins: 100 µm) and averaged version of the non-paired corticospinal (blue) and corticostriatal (red) neuron data shown in Fig. 1d and Fig. 2d.
Fig. 6
Fig. 6
Input patterns for ipsilaterally projecting corticostriatal neurons, showing that the majority have the same circuit phenotype observed for the crossed corticostriatal neurons. (a) Example of a neuron in layer 5A receiving strong layer 2/3 input, mostly from upper layer 2/3. (b) Example of a neuron in layer 5B receiving weak layer 2/3 input. (c) Example of a neuron in layer 5B receiving strong layer 2/3 input, mostly from lower layer 2/3. (d) Synaptic input as a function of presynaptic location (absolute distance of soma from pia). Asterisks indicate map rows where the two cell groups differed significantly (P < 0.05, t-test).
Fig. 7
Fig. 7
Laminar connectivity matrix analysis, showing partial segregation of L2/3 inputs to corticostriatal and corticospinal neurons. (a) Average input maps, generated by sorting individual cells’ maps by soma position, binning, and averaging. (b) Average input vectors, made by averaging the input maps along map rows. (c) The set of input vectors constitutes a laminar connectivity matrix (Wpost,pre). (d) Connectivity matrices for the two projection neuron classes. Small gray brackets indicate the data-containing regions. (e) Same as in panel d, but with the matrices on separate color scales (left; corticospinal: blue, corticostriatal: red) and merged (right; same color scales; magenta represents overlap). Image in lower right is same as in upper right but on a compressed color scale; two smaller circles mark the hotspots of layer 2/3 input, and larger circle marks region of layer 5/6 input. (f) Synaptic output maps, computed for presynaptic neurons in upper layer 2/3 (left; corresponds to column i in panel e) and mid layer 2/3 (right; corresponds to column ii in panel e). See Methods for details. Color definitions same as for panel e. (g) Profile of mean input to the two projection neuron classes as a function of presynaptic stimulus location. Gray lines delimit layer 2/3. Asterisks indicate significant differences (P < 0.05, t-test). (h) The strongest quartile of elements in the connectivity matrices, redrawn as arrows.

References

    1. Thomson AM, Bannister AP. Interlaminar connections in the neocortex. Cereb Cortex. 2003;13:5–14. - PubMed
    1. Douglas RJ, Martin KA. Neuronal circuits of the neocortex. Annu Rev Neurosci. 2004;27:419–451. - PubMed
    1. Weiler N, Wood L, Yu J, Solla SA, Shepherd GMG. Top-down laminar organization of the excitatory network in motor cortex. Nat Neurosci. 2008;11:360–366. - PMC - PubMed
    1. Shepherd GMG. Intracortical cartography in an agranular area. Frontiers in Neuroscience. 2009 - PMC - PubMed
    1. Morishima M, Kawaguchi Y. Recurrent connection patterns of corticostriatal pyramidal cells in frontal cortex. J Neurosci. 2006;26:4394–4405. - PMC - PubMed

Publication types

MeSH terms

Substances