. 2010 Jun;6(6):411-7.
doi: 10.1038/nchembio.364. Epub 2010 May 2.

Metabolic oxidation regulates embryonic stem cell differentiation

Affiliations

Metabolic oxidation regulates embryonic stem cell differentiation

Oscar Yanes et al. Nat Chem Biol. 2010 Jun.

Abstract

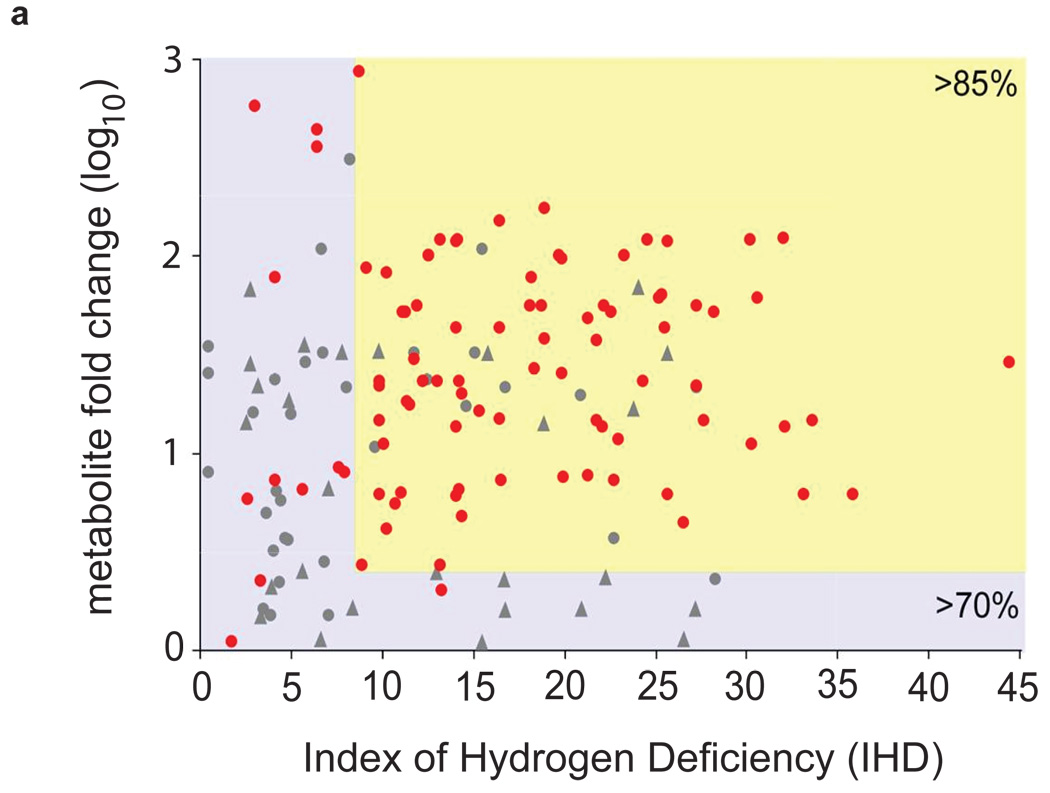
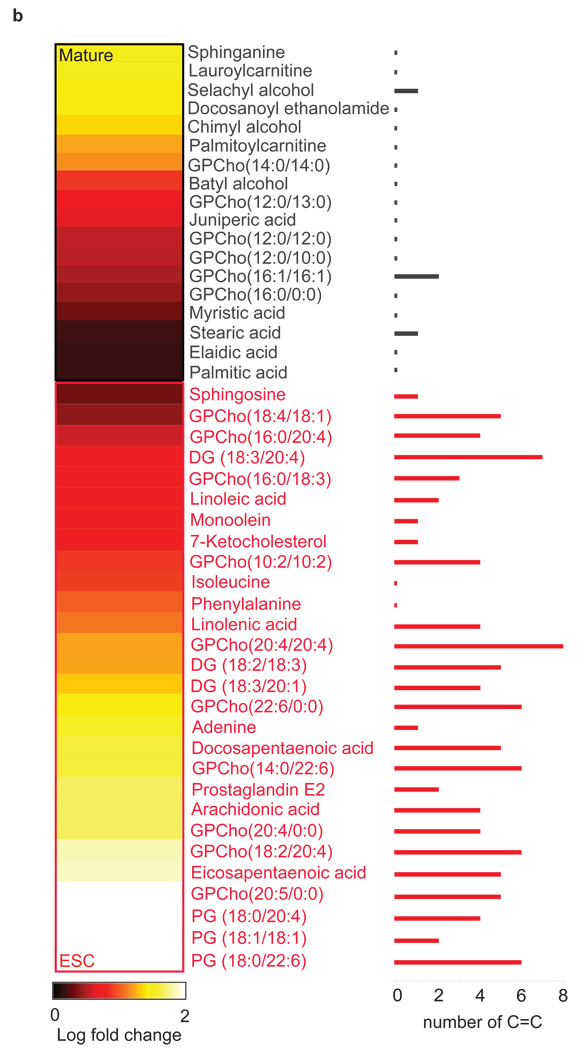
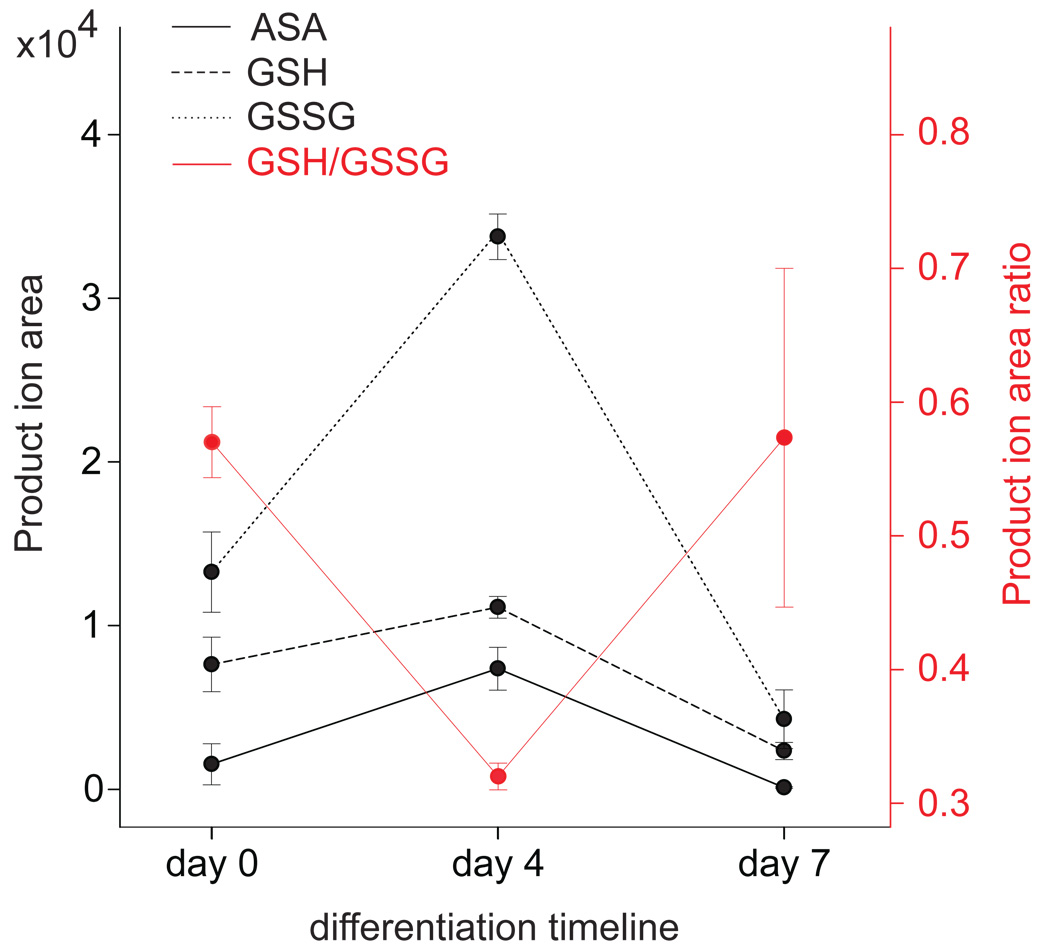
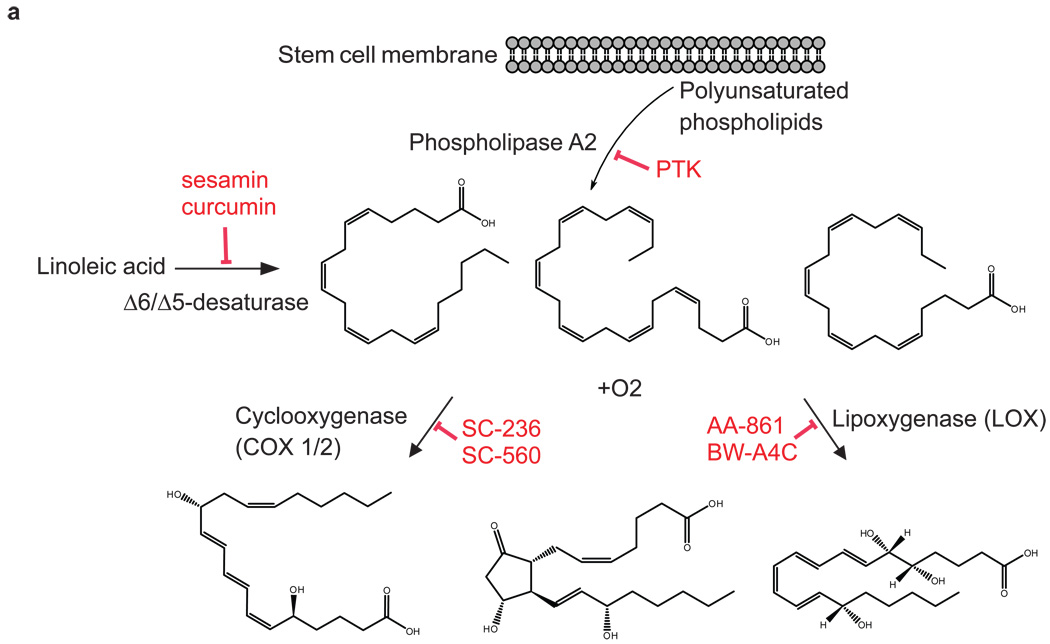
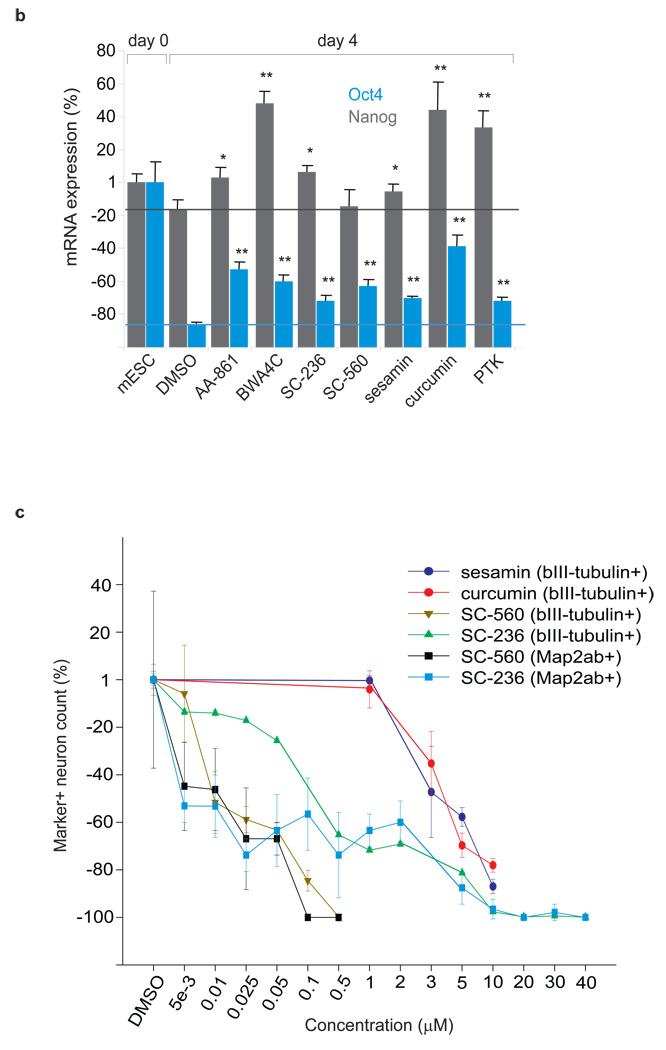
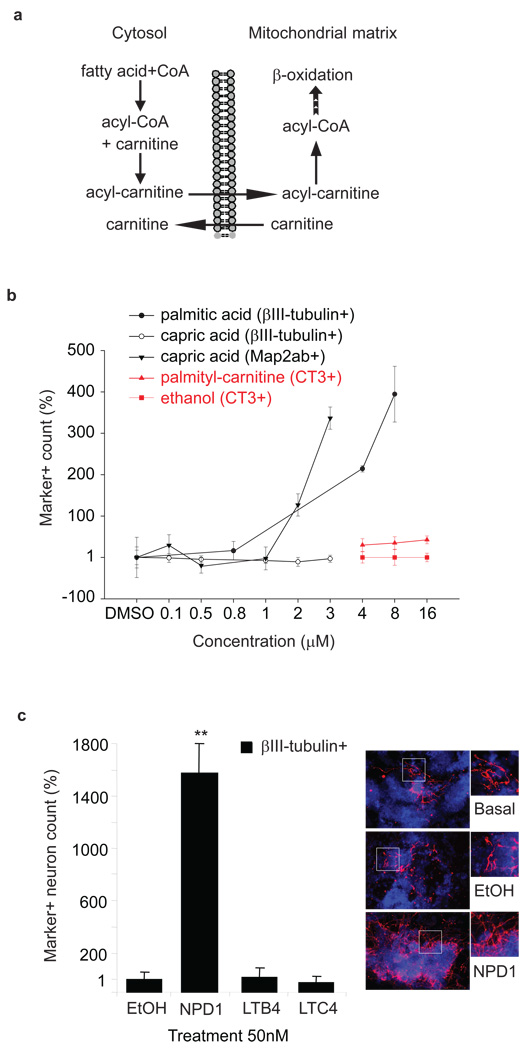
Metabolites offer an important unexplored complementary approach to understanding the pluripotency of stem cells. Using MS-based metabolomics, we show that embryonic stem cells are characterized by abundant metabolites with highly unsaturated structures whose levels decrease upon differentiation. By monitoring the reduced and oxidized glutathione ratio as well as ascorbic acid levels, we demonstrate that the stem cell redox status is regulated during differentiation. On the basis of the oxidative biochemistry of the unsaturated metabolites, we experimentally manipulated specific pathways in embryonic stem cells while monitoring the effects on differentiation. Inhibition of the eicosanoid signaling pathway promoted pluripotency and maintained levels of unsaturated fatty acids. In contrast, downstream oxidized metabolites (for example, neuroprotectin D1) and substrates of pro-oxidative reactions (for example, acyl-carnitines), promoted neuronal and cardiac differentiation. We postulate that the highly unsaturated metabolome sustained by stem cells allows them to differentiate in response to in vivo oxidative processes such as inflammation.


Figures

Figure 1
Figure 1. Embryonic stem cells are characterized by abundant metabolites with highly unsaturated structures
(a) Degree of unsaturation in embryonic stem cells (ESCs) and mature populations. The plot shows the relative fold change of metabolites that are either (i) up-regulated in ESCs (red dots) or (ii) up-regulated in mature populations (gray dots and gray triangles to represent neurons and cardiomyocytes respectively) vs. the index of hydrogen deficiency (IHD) of each metabolite. Of the molecular formulas we characterized in ESCs, 85% have IHD values ≥ 8 and fold increases ≥ 5 (yellow-shaded area). Of the molecular formulas we characterized in mature populations, 70% have IHD values ≤ 8 and/or fold increases ≤ 5 (blue-shaded area). (b) Heatmap showing 46 metabolites whose structures were identified by tandem MS. Lighter colors (yellow and white) correspond to the largest fold changes, where fold is defined as the relative difference between the integrated peak area of each feature in ESCs relative to mature populations. Metabolite names shown in black are up-regulated in mature populations relative to ESCs (p<0.01). Metabolite names shown in red are up-regulated in ESCs relative to mature populations (p<0.01). The number of C-C double bonds for each metabolite is shown by the bar graph on the right.
Figure 2
Figure 2. GSH/GSSG ratio and ascorbic acid levels are inversely related in response to ESC differentiation
Ascorbic acid (ASA), reduced glutathione (GSH), and oxidized glutathione (GSSG) abundance, and GSH/GSSG ratio as a function of days of differentiation of mESCs. Values were determined by the integrated peak areas of product ions using triple quadrupole mass spectrometry and multiple reaction monitoring (see Supplementary Methods for details). Error bars represent mean values and standard deviation for three independently prepared replicates (4 million cells) of each time point.
Figure 3
Figure 3. Inhibition of the eicosanoid signaling pathway promotes the pluripotent state of embryonic stem cells
(a) The eicosanoid signaling pathway is mediated by the enzymes phospholipase A2 (PLA2), cyclooxygenase (COX), and lipooxygenase (LOX). PLA2 hydrolyzes phospholipids from the cellular membrane releasing AA, EPA or DHA, and lysophospholipids . In the presence of O2, COX and LOX oxidize C=C from AA, EPA, and DHA thereby producing important biological eicosanoid mediators that regulate the inflammatory response, such as thromboxanes, prostaglandins, and prostacyclins, producing reactive oxygen species (ROS) in the process . (b) Inhibition of PLA2, COX, LOX, and desaturase delays the loss of pluripotency at day 4, as indicated by the higher expression of pluripotent markers Oct4 (green) and Nanog (red) relative to the DMSO control (green and red lines as references). Sample labeled mESC corresponds to the levels of expression of Oct4 and Nanog at day 0 (taken for normalization). *indicates a p-value < 0.05. ** indicates a p-value < 0.001. (c) Fatty acid 5Δ and 6Δ desaturase inhibition by curcumin and sesamin, and COX inhibition by SC236 and SC560, significantly delay differentiation and neuron maturation. ESC cultures were treated with either curcumin, sesamin, COX inhibitors, or a DMSO control at various concentrations from days 1–10 of differentiation. Neuronal differentiation was evaluated with βIII-tubulin positive or Map2ab/βIII-tubulin double positive neuron counts at day 10 of differentiation. Four cell culture replicates were analyzed for each inhibitor concentration. Data points and error bars represent mean values and s.d.
Figure 4
Figure 4. Metabolites that undergo mitochondrial β-oxidation, and neuroprotectin D1 promote cardiac and neuronal differentiation
(a) Role of acyl-carnitines in fatty acid metabolism in the mitochondria. (b) Saturated fatty acids and acyl-carnitines enhance neuronal and cardiomyocyte differentiation, respectively. Map2ab/βIII-tubulin double positive neuron count increases with higher concentrations of palmitic acid (0.8 µM to 8µM) and capric acid (0.1 µM to 3 µM). An increase in CT-3 positive clusters was observed with increasing concentrations of palmityl-carnitine. Differentiation media was supplemented with 4, 8, or 16 µM concentrations of palmityl-carnitine for the first 9 days and the metabolite removed for the last day of differentiation. Cardiomyocyte differentiation was evaluated with CT3 staining, an antibody for the cardiac cell marker cardiotroponin. Marker positive counts in ES cells differentiated in the absence of DMSO or ethanol were not different from the DMSO or ethanol controls. (c) Neuroprotectin D1 (NPD1) enhances neuronal differentiation. Differentiation media was supplemented with 50 nM of NPD1, leukotriene B4 or C4 throughout differentiation. ** indicates p-value < 0.001 as compared to that of ethanol treated cells. Photographs show neuronal differentiation evaluated with βIII-tubulin (red) staining. Nuclear staining was performed with DAPI (blue). Four independently prepared cell culture replicates were analyzed for each metabolite concentration. Data points and error bars represent mean values and s.d.

References

    1. Azuara V, et al. Chromatin signatures of pluripotent cell lines. Nat Cell Biol. 2006;8:532–538. - PubMed
    1. Bernstein BE, et al. A bivalent chromatin structure marks key developmental genes in embryonic stem cells. Cell. 2006;125:315–326. - PubMed
    1. Graumann J, et al. Stable isotope labeling by amino acids in cell culture (SILAC) and proteome quantitation of mouse embryonic stem cells to a depth of 5,111 proteins. Mol Cell Proteomics. 2008;7:672–683. - PubMed
    1. Foss EJ, et al. Genetic basis of proteome variation in yeast. Nat Genet. 2007;39:1369–1375. - PubMed
    1. Gygi SP, Rochon Y, Franza BR, Aebersold R. Correlation between protein and mRNA abundance in yeast. Mol Cell Biol. 1999;19:1720–1730. - PMC - PubMed

Publication types