. 2010 Jun;6(6):457-63.
doi: 10.1038/nchembio.363. Epub 2010 May 2.

Small molecules discovered in a pathway screen target the Rho pathway in cytokinesis

Affiliations

Small molecules discovered in a pathway screen target the Rho pathway in cytokinesis

Adam B Castoreno et al. Nat Chem Biol. 2010 Jun.

Abstract

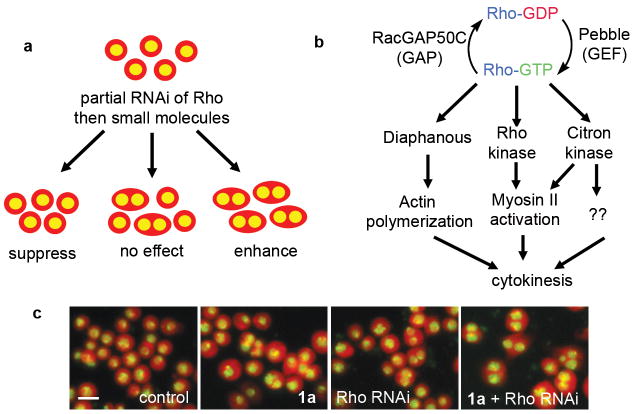
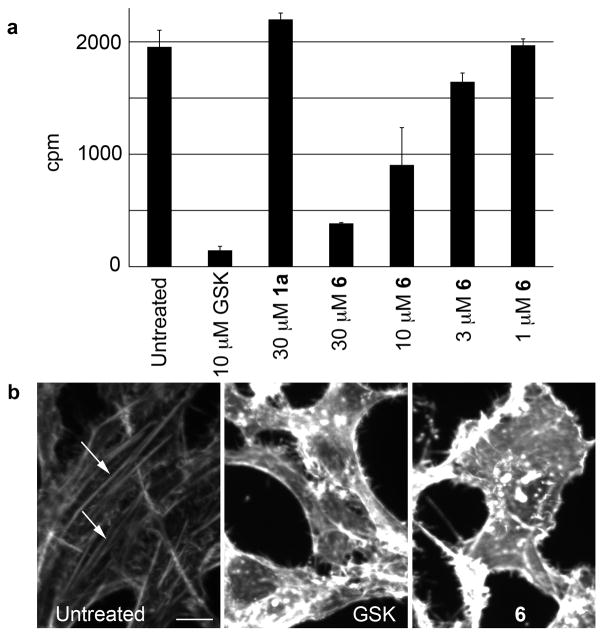
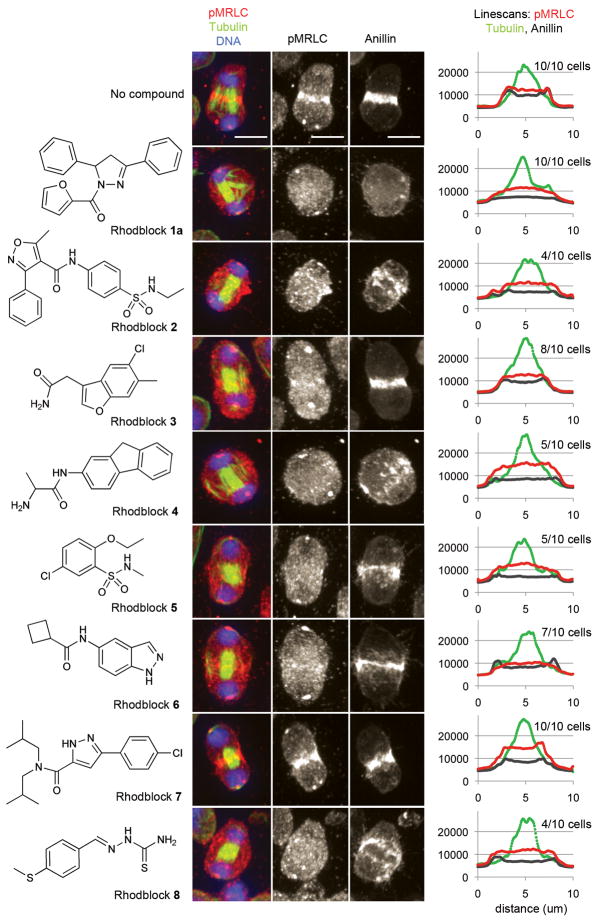
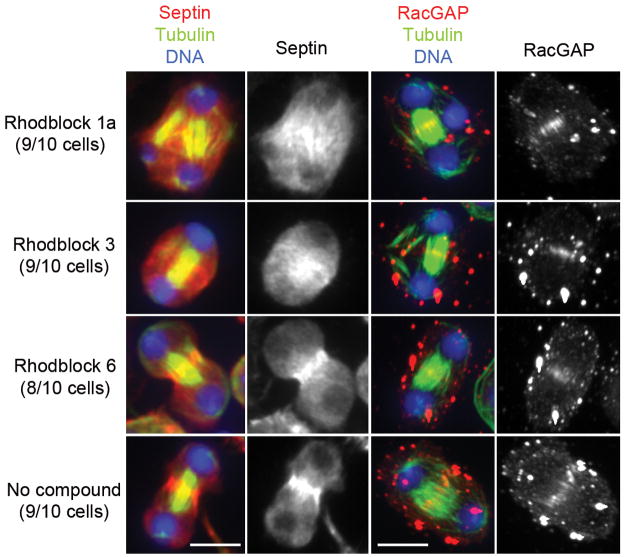
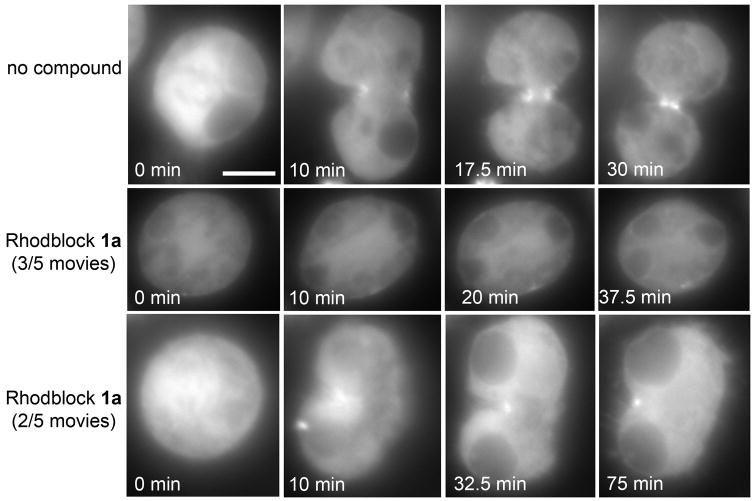
We report the discovery of small molecules that target the Rho pathway, which is a central regulator of cytokinesis--the final step in cell division. We have developed a way of targeting a small molecule screen toward a specific pathway, which should be widely applicable to the investigation of any signaling pathway. In a chemical genetic variant of a classical modifier screen, we used RNA interference (RNAi) to sensitize cells and identified small molecules that suppressed or enhanced the RNAi phenotype. We discovered promising candidate molecules, which we named Rhodblock, and we identified the target of Rhodblock as Rho kinase. Several Rhodblocks inhibited one function of the Rho pathway in cells: the correct localization of phosphorylated myosin light chain during cytokinesis. Rhodblocks differentially perturb Rho pathway proteins in cells and can be used to dissect the mechanism of the Rho pathway during cytokinesis.


Conflict of interest statement

The authors declare no competing financial interests.

Figures

Figure 1
Figure 1
(a) A small molecule/RNAi modifier screen. (Whole cells are cartooned in red, nuclei in yellow). (b) Simplified diagram of Rho signaling during cytokinesis. (c) Example of synergy between Rho RNAi and a hit compound (Rhodblock 1a). Note how the percentage of binucleate cells is relatively low in cells that are treated with RNAi or compound, but increases with both RNAi and compound treatment (Drosophila Kc167 cells are shown in red, nuclei in yellow). The scale bar shown in the control image represents 10μm.
Figure 2
Figure 2
(a) Drosophila Rho kinase assay data for Rhodblock 6. A dose-response curve is shown as well as control data for the Rho kinase inhibitor GSK269962A and Rhodblock 1a. For a full panel, see Supplementary Figure 6. Error bars indicate standard deviation (n=2). (b) Rhodblock 6 (100μM) and GSK269962A (10 μM) cause disappearance of actin stress fibers in HeLa cells (white arrows in control image. HeLa cells were treated for 20 h and fixed. Actin was visualized using phalloidin staining. The scale bar shown in the control image represents 10μm.
Figure 3
Figure 3. Several Rhodblocks prevent the accumulation of phospho-myosin regulatory light chain and/or Anillin at the cleavage furrow.
The chemical structures of Rhodblocks 1a–8 are shown on the left. Immunofluorescence images of representative phenotypes for each Rhodblock are shown in the middle. Phospho-MRLC (red), tubulin (green) and DNA (blue) have been visualized in Drosophila Kc167 cells. For greater clarity, the middle panel shows gray-scale images of phospho-MRLC staining only. The right panel shows gray-scale images of Anillin staining in the same cell. The images were taken under identical conditions and were processed identically (see Supplementary Methods). The scale bar shown in the control images represents 5μm. We analyzed images of 10 cells for each condition (4 h treatment with compound at the minimally synergistic concentration after overnight Rho RNAi sensitization). For each cell we analyzed, we placed a line across the cleavage furrow and quantitated the fluorescence intensities for phospho-MRLC, Anillin and tubulin staining (see Supplementary Methods). We then averaged the line scans for cells exhibiting the phospho-MRLC phenotype shown in this figure (shown on the right). The number of cells represented by the image is shown in parentheses above the linescans for each compound. In the linescans, the x axis represents fluorescence intensity (AU). Bumps in fluorescence intensities at the edge of the cell are characteristic of an intact furrow (e.g. control cell), uniform fluorescence intensities across the entire cell are characteristic of a missing furrow (e.g. Rhodblock 1a). In Rhodblock 6-treated cells, Anillin forms a furrow while phospho-MRLC does not.
Figure 4
Figure 4. Effect of Rhodblocks 1a, 3 and 6 on cytokinesis protein localization
The septin Peanut and RacGAP are shown in red in the color-combined figure and again for greater clarity in grey in the neighboring image. Microtubules are shown in green and DNA in blue. Cells were treated with compound for 4 h at the minimally synergistic concentration after overnight Rho RNAi sensitization. The septin Peanut localizes to midzone microtubules in Rhodblock 1a-treated cells and is partially microtubule-bound and partially diffuse in Rhodblock 3-treated cells. We analyzed images of 10 cells for each condition for Peanut staining. The number of cells represented by the image is shown in parentheses for each compound. RacGAP localization is not perturbed by any Rhodblocks. See Supplementary Figure 9 for Actin, Rho and Pavarotti staining. The images for each set of markers were taken under identical conditions and were processed identically (see Supplementary Methods). The scale bar represents 5μm.
Figure 5
Figure 5. Movie stills of GFP-MRLC S2 cells treated with 100μM Rhodblock 1a after overnight Rho RNAi sensitization
In 3/5 movies (middle panel), no furrows formed and cells failed to ingress. In 2/5 movies (lower panel) a partial furrow formed, briefly ingressed and broke apart. Movie timing was started at the beginning of anaphase. The scale bar shown in the first frame of the control movie represents 5μm.

Comment in

  • Giving Rho(d) directions.
    Muellner MK, Nijman SM. Muellner MK, et al. Nat Chem Biol. 2010 Jun;6(6):397-8. doi: 10.1038/nchembio.373. Nat Chem Biol. 2010. PMID: 20479746 No abstract available.

References

    1. Jaffe AB, Hall A. Rho GTPases: biochemistry and biology. Annu Rev Cell Dev Biol. 2005;21:247–269. - PubMed
    1. Gomez del Pulgar T, Benitah SA, Valeron PF, Espina C, Lacal JC. Rho GTPase expression in tumourigenesis: evidence for a significant link. Bioessays. 2005;27:602–613. - PubMed
    1. Budzyn K, Marley PD, Sobey CG. Targeting Rho and Rho-kinase in the treatment of cardiovascular disease. Trends Pharmacol Sci. 2006;27:97–104. - PubMed
    1. Fritz G, Brachetti C, Bahlmann F, Schmidt M, Kaina B. Rho GTPases in human breast tumours: expression and mutation analyses and correlation with clinical parameters. Br J Cancer. 2002;87:635–644. - PMC - PubMed
    1. Fritz G, Just I, Kaina B. Rho GTPases are over-expressed in human tumors. Int J Cancer. 1999;81:682–687. - PubMed

Publication types

MeSH terms