. 2010 Aug;37(8):1539-50.
doi: 10.1007/s00259-010-1443-z. Epub 2010 May 2.

Image-derived input function in dynamic human PET/CT: methodology and validation with 11C-acetate and 18F-fluorothioheptadecanoic acid in muscle and 18F-fluorodeoxyglucose in brain

Affiliations

Image-derived input function in dynamic human PET/CT: methodology and validation with 11C-acetate and 18F-fluorothioheptadecanoic acid in muscle and 18F-fluorodeoxyglucose in brain

Etienne Croteau et al. Eur J Nucl Med Mol Imaging. 2010 Aug.

Abstract

Purpose: Despite current advances in PET/CT systems, blood sampling still remains the standard method to obtain the radiotracer input function for tracer kinetic modelling. The purpose of this study was to validate the use of image-derived input functions (IDIF) of the carotid and femoral arteries to measure the arterial input function (AIF) in PET imaging. The data were obtained from two different research studies, one using (18)F-FDG for brain imaging and the other using (11)C-acetate and (18)F-fluoro-6-thioheptadecanoic acid ((18)F-FTHA) in femoral muscles.

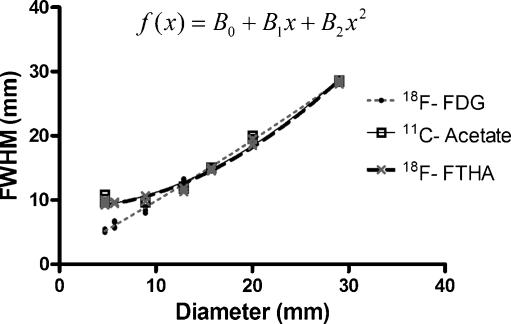
Methods: The method was validated with two phantom systems. First, a static phantom consisting of syringes of different diameters containing radioactivity was used to determine the recovery coefficient (RC) and spill-in factors. Second, a dynamic phantom built to model bolus injection and clearance of tracers was used to establish the correlation between blood sampling, AIF and IDIF. The RC was then applied to the femoral artery data from PET imaging studies with (11)C-acetate and (18)F-FTHA and to carotid artery data from brain imaging with (18)F-FDG. These IDIF data were then compared to actual AIFs from patients.

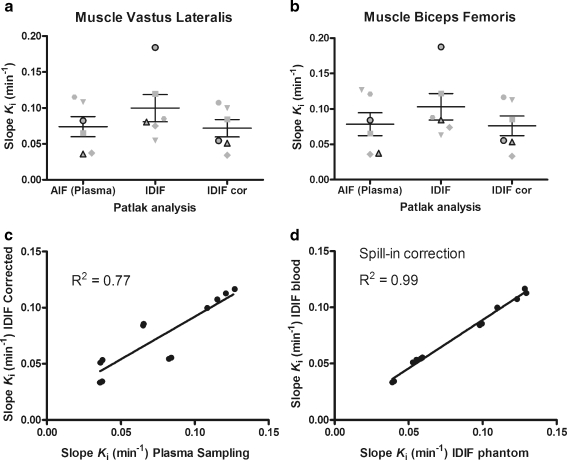
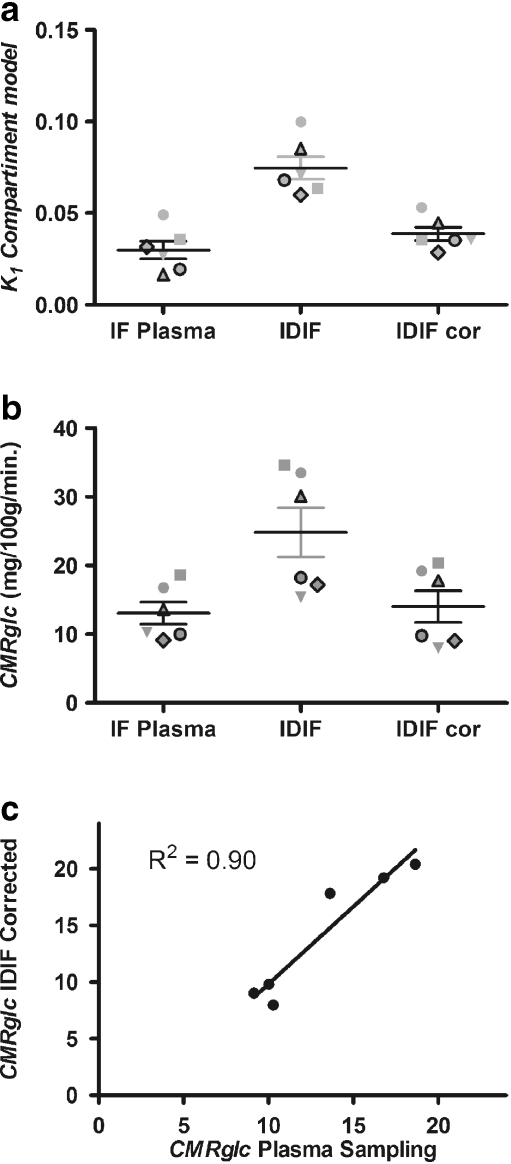
Results: With (11)C-acetate, the perfusion index in the femoral muscle was 0.34+/-0.18 min(-1) when estimated from the actual time-activity blood curve, 0.29+/-0.15 min(-1) when estimated from the corrected IDIF, and 0.66+/-0.41 min(-1) when the IDIF data were not corrected for RC. A one-way repeated measures (ANOVA) and Tukey's test showed a statistically significant difference for the IDIF not corrected for RC (p<0.0001). With (18)F-FTHA there was a strong correlation between Patlak slopes, the plasma to tissue transfer rate calculated using the true plasma radioactivity content and the corrected IDIF for the femoral muscles (vastus lateralis r=0.86, p=0.027; biceps femoris r=0.90, p=0.017). On the other hand, there was no correlation between the values derived using the AIF and those derived using the uncorrected IDIF. Finally, in the brain imaging study with (18)F-FDG, the cerebral metabolic rate of glucose (CMRglc) measured using the uncorrected IDIF was consistently overestimated. The CMRglc obtained using blood sampling was 13.1+/-3.9 mg/100 g per minute and 14.0+/-5.7 mg/100 g per minute using the corrected IDIF (r ( 2 )=0.90).

Conclusion: Correctly obtained, carotid and femoral artery IDIFs can be used as a substitute for AIFs to perform tracer kinetic modelling in skeletal femoral muscles and brain analyses.


Figures

Fig. 1
Fig. 1
The static arterial phantom was used to obtain the recovery factors for cylindrical objects (syringes) ranging in diameter from 4 to 29 mm (a) and equations to calculate the spill-in ratio (b). a The phantom was imaged on the Philips Gemini TF PET/CT scanner with 18F (dashed line, diamonds) and on the Gemini GXL PET/CT scanner with 11C (solid line, triangles) and with 18F (dotted line, circles). These data were then fitted using Eq. 1, and the fits are represented by the curves. b Symbols represent a series of activities and the exponential fit to the data
Fig. 2
Fig. 2
Correlation between FWHM measured in the PET images using an activity profile across the centre of the syringes and the actual diameter of the static arterial phantom syringes. Lines represent the fits: for the 18F-FDG brain imaging protocol with 2-mm voxels on the Gemini TF PET/CT scanner (dotted line, circles), and for 11C-acetate (solid line, squares) and 18F-FTHA with a whole-body protocol and 4-mm voxels on the Gemini GXL PET/CT scanner (dashed line, crosses)
Fig. 3
Fig. 3
Time–activity curves of input functions from withdrawn blood samples and the IDIF with the appropriate correction. a Dynamic artery phantom designed to model radiotracer influx and blood clearance. The phantom was made from Tygon tubing, 6.35 mm diameter, entering the PET scanner field of view and attached to a water reservoir used to introduce the radiotracer into the system. Samples taken from the phantom (solid circles) were used as reference and were compared to data obtained from uncorrected IDIF (dashed line) and the IDIF-corrected for partial volume using the corresponding diameter estimated from the FWHM (solid line). b, c Examples of input function for a 18F-FDG brain study and for a 18F-FTHA muscle study (solid circles blood samples, dashed line IDIF not corrected. solid line IDIF corrected)
Fig. 4
Fig. 4
a, b 11C-acetate perfusion index, K 1, for the vastus lateralis (a) and biceps femoris (b) obtained by kinetic analysis with a three-compartment model. For each muscle, the average and range of K 1 values were obtained from an AIF derived by blood sampling (Blood), IDIF and corrected for PVE (IDIFcor). c The K 1 values obtained from blood sampling are also correlated with the corrected IDIF values. The data from each subject are identified by the same symbol across all conditions
Fig. 5
Fig. 5
a, b Slope of the plasma to tissue transfer rate, K i (min−1), of 18F−FTHA for the vastus lateralis (a) and biceps femoris (b) obtained by Patlak graphical analysis. For each muscle, the average and range of K i was obtained from an AIF derived from blood sampling (Plasma), uncorrected IDIF and corrected for PVE and spillover (IDIF cor). The data from each patient are identified by the same symbol across all conditions. c The K i values obtained from blood sampling are correlated with the corrected IDIF values. d The values of K i measured using IDIF corrected for spill-in with the late blood sample are correlated with the K i measured using IDIF corrected for spill-in with the static phantom-derived function
Fig. 6
Fig. 6
CMRglc from standard three-compartment model analyses of 18F-FDG dynamic brain imaging, using an ROI on the frontal lobe of the brain. a The K 1 fit from the compartmental model was computed using three different input functions: plasma sampling (Plasma), IDIF without correction, and IDIF corrected for carotid artery PVE (IDIF cor). b CMRglc was computed using three different input functions: plasma sampling (Plasma), IDIF without correction, and IDIF corrected for carotid artery partial volume (IDIF cor). For each subject, the diameter of the carotid artery was obtained from the bolus PET/CT coregistration images by measuring artery size on the CT image. The data from each patient are identified by the same symbol across all conditions. c Correlation between CMRglc of the frontal brain region derived from plasma sampling and from IDIF corrected for PVE

References

    1. Logan J, Alexoff D, Kriplani A. Simplifications in analyzing positron emission tomography data: effects on outcome measures. Nucl Med Biol. 2007;34:743–756. doi: 10.1016/j.nucmedbio.2007.06.003. - DOI - PubMed
    1. van der Weerdt AP, Klein LJ, Boellaard R, Visser CA, Visser FC, Lammertsma AA. Image-derived input functions for determination of MRGlu in cardiac (18)F-FDG PET scans. J Nucl Med. 2001;42:1622–1629. - PubMed
    1. Wu HM, Hoh CK, Choi Y, et al. Factor analysis for extraction of blood time-activity curves in dynamic FDG-PET studies. J Nucl Med. 1995;36:1714–1722. - PubMed
    1. Phillips RL, Chen CY, Wong DF, London ED. An improved method to calculate cerebral metabolic rates of glucose using PET. J Nucl Med. 1995;36:1668–1679. - PubMed
    1. Graham MM, Peterson LM, Hayward RM. Comparison of simplified quantitative analyses of FDG uptake. Nucl Med Biol. 2000;27:647–655. doi: 10.1016/S0969-8051(00)00143-8. - DOI - PubMed

Publication types