Evaluation of on-road driving in people with hemianopia and quadrantanopia
- PMID: 20437914
- PMCID: PMC2964938
- DOI: 10.5014/ajot.64.2.268
Evaluation of on-road driving in people with hemianopia and quadrantanopia
Abstract
Objective: To examine whether some drivers with hemianopia or quadrantanopia display safe driving skills on the road compared with drivers with normal visual fields.
Method: An occupational therapist evaluated 22 people with hemianopia, 8 with quadrantanopia, and 30 with normal vision for driving skills during naturalistic driving using six rating scales.
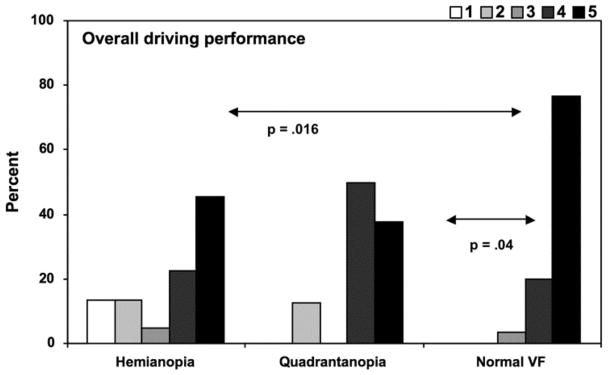
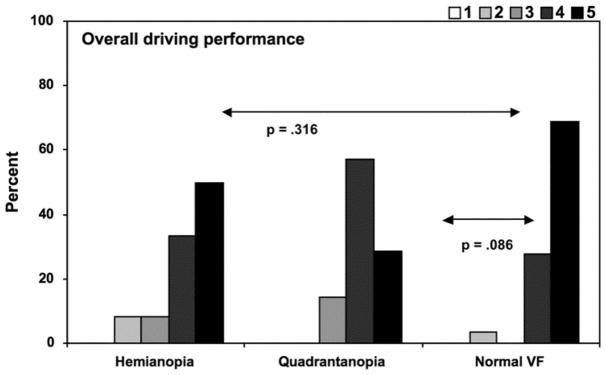
Results: Of drivers with normal vision, > 90% drove flawlessly or had minor errors. Although drivers with hemianopia were more likely to receive poorer ratings for all skills, 59.1%-81.8% performed with no or minor errors. A skill commonly problematic for them was lane keeping (40.9%). Of 8 drivers with quadrantanopia, 7 (87.5%) exhibited no or minor errors.
Conclusion: This study of people with hemianopia or quadrantanopia with no lateral spatial neglect highlights the need to provide individual opportunities for on-road driving evaluation under natural traffic conditions if a person is motivated to return to driving after brain injury.
Figures
References
-
- Bowers A, Peli E, Elgin J, McGwin G, Owsley C. On-road driving with moderate visual field loss. Optometry and Vision Science. 2005;82(8):657–667. - PubMed
-
- Cassidy TP, Bruce DW, Gray CS. Visual field loss after stroke: Confrontation and perimetry in the assessment of recovery. Journal of Stroke and Cerebrovascular Diseases. 2001;10(3):113–117. - PubMed
-
- Di Stefano M, MacDonald W. Assessment of older drivers: Relationships among on-road errors, medical conditions and test outcome. Journal of Safety Research. 2003;34:415–429. - PubMed
-
- Elliott DB, Bullimore MA, Bailey IL. Improving the reliability of the Pelli-Robson contrast sensitivity test. Clinical Vision Science. 1991;6:471–475.