. 2010 May 26;132(20):7025-37.
doi: 10.1021/ja909514j.

Structural responses of DNA-DDAB films to varying hydration and temperature

Affiliations

Structural responses of DNA-DDAB films to varying hydration and temperature

Thorsten Neumann et al. J Am Chem Soc. .

Abstract

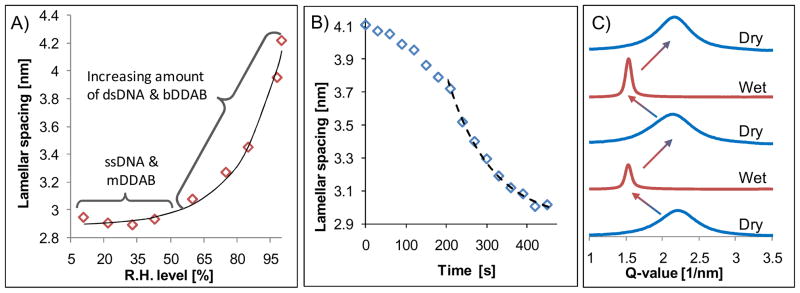
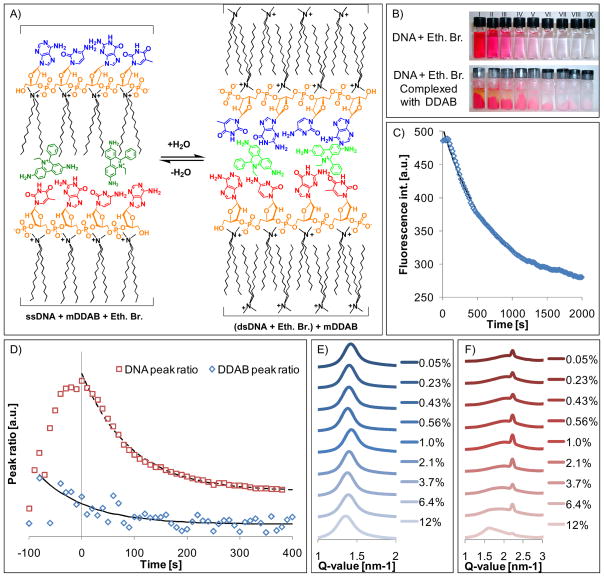
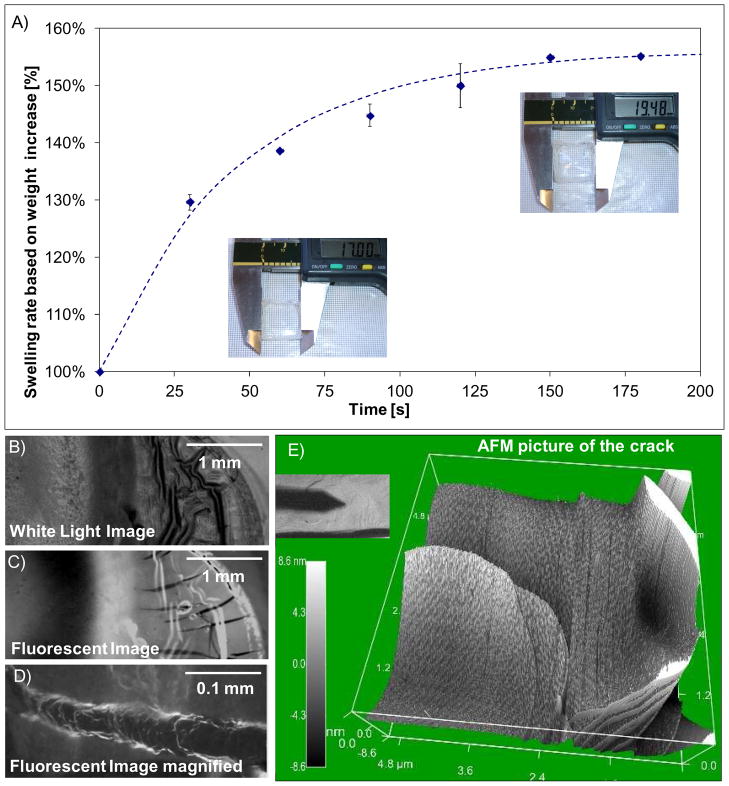
The structure of a DNA-dimethyldidodecylammonium bromide (DDAB) film was recently described to undergo a distinctive transition in response to the water content in the surrounding environment. The existence, preparation, and basic properties of DNA-surfactant films have been known in the literature for some time. Here, we describe the structural response of DNA-DDAB films to environmental changes, particularly temperature and humidity, in greater detail revealing new structural states. We can direct the lamellar structure of the film into three distinct states--double-stranded DNA (dsDNA) paired with an interdigitated bilayer of DDAB (bDDAB), single-stranded DNA (ssDNA) with monolayer of DDAB (mDDAB), and ssDNA with bDDAB. Both temperature and humidity cause the molecules composing the lamellar structure to change reversibly from ssDNA to dsDNA and/or from mDDAB to bDDAB. We found that the structural transition from dsDNA to ssDNA and bDDAB to mDDAB is concerted and follows apparent first-order kinetics. We also found that the double-stranded conformation of DNA in the film can be stabilized with the inclusion of cholesterol even while the DDAB in the film is able to form either a monolayer or bilayer depending on the environmental conditions. Films treated with ethidium bromide prompt switching of dsDNA to ssDNA before bDDAB transitions to mDDAB. Swelling experiments have determined that there is a direct proportionality between the macroscopic increase in volume and the nanoscopic increase in lamellar spacing when a film is allowed to swell in water. Finally, experiments with phosphate-buffered saline (PBS) indicate that the films can disassemble in a simulated biological environment due to screening of their charges by buffer salt. We conclude that the structure of DNA in the film depends on the water content (as measured by the relative humidity) and temperature of the environment, while the state of DDAB depends essentially only on the water content. The structure of the film is quite flexible and can be altered by changing environmental conditions as well as the chemical ingredients. These films will have useful, new applications as responsive materials, for example, in drug and gene delivery.


Figures

Figure 1
Figure 1
(A) Summary of FT-IR spectra of the DNA base pair region taken every ten seconds as a water-immersed film dried for 400 seconds. Decrease in the peak ratios of 1690 to 1650 cm−1 of the DNA base pair and DDAB tail regions averaged over four sequential measurements with error bars showing the standard deviation for each point. The DDAB values are amplified by a factor of 60 compared to the DNA values for comparison purposes. The peak ratio decreases (and therefore the structural switching of DNA and DDAB) occur virtually simultaneously, as indicated in the k values of the exponential curve fit. The curve fit for the DNA peak ratio is y = 1.577 + 2.563·e(−0.017· time) and the curve fit for the DDAB peak ratio is y = 0.846 + 1.098·e(−0.011·time). (C) FT-IR spectra of the DNA base pair region of a cast film at different relative humidity (R.H.) levels showing the gradual transition from ssDNA (11% R.H.) to dsDNA (95% R.H.). Dotted lines indicate the peak positions at 1650 and 1690 cm−1. (D) Peak ratio intensities of the DNA base pair and DDAB tail regions increase with increasing humidity levels, again showing the nearly simultaneous structural transition of DNA and DDAB.
Figure 2
Figure 2
Small angle X-ray (SAXS) scattering of the DNA-DDAB films at various humidity levels. An increase in humidity leads to a structural swelling of the film with a correspondingly increasing lamellar spacing (A). The black dotted line indicates the shift of the main scattering peak with increasing humidity. The transition begins to occur more dramatically at a threshold value of approximately 60% R.H. which agrees with FT-IR measurements. The exponential curve fit is y = 0.01·e0.05x + 2.90. The timing of this transition was monitored by synchrotron SAXS experiments using a water-immersed cast film. The black line indicates the position of the main scattering peak at various humidity levels (B). The slope of the decrease in lamellar spacing as the film dries is nearly identical to the slope of the decrease in peak ratios measured by FT-IR, indicating that the two techniques are sufficiently comparable and that the timing of the film’s switching is unchanged regardless of drying conditions and film thickness. The structural transition caused by hydration and dehydration is fully reversible (C) which could be seen in the identical peak width and q-value for all wet and dry films, respectively.
Figure 3
Figure 3
Temperature response of the DNA-DDAB films. By comparing the peak value at 245 nm in the CD-spectra of native DNA and a wet and dry film during the same heating process and using a Boltzmann curve fitting (A), the melting temperature of DNA in the wet film is ~63.1 °C, compared to ~71.2 °C for native DNA, a decrease presumably due to complexation of DNA by DDAB which reduces backbone repulsion between the two strands which would lower the melting point. The T values for each curve indicate the broadness (i.e. the homogeneity of helical DNA), as measured in degrees Celsius, of the DNA melting point. No reasonable melting temperature could be obtained for the DNA in the dry film, indicating that it is single-stranded and cannot melt. Similar behavior was noted in the SAXS spectra of wet (B) and dry DNA films (Supporting Information Figure S11). As the temperature increases the q-value of the main scattering peak of the wet DNA-DDAB film increases and the lamellar spacing correspondingly decreases from 4.4 to 3.6 nm, suggesting that the heated wet film consists of bDDAB (2.4 nm) + ssDNA (1.1 nm). The CD results in combination with SAXS (B) experiments of the wet film indicate that the DDAB remains in bilayer formation while the DNA becomes single stranded. The heat treatment, even after several cycles, does not change the structure of the wet film, indicating that it is thermostable (C).
Figure 4
Figure 4
Expected states of DNA and DDAB in the cast film which can be reversibly altered by the surrounding conditions as summarized from the data in the above figures. The dry film consists of ssDNA and mDDAB (left) which changes to bDDAB paired with dsDNA when the film is immersed in water (middle). The DNA becomes single stranded in the presence of bDDAB when the temperature of the wet film is raised above the melting point of the nucleic acid (right) which is ~71 °C according to CD measurements (Figure 3A), and then anneals as the temperature is lowered. The water molecules fill the spaces between the separated DNA bases, though it is unknown how far the strands separate when heated.
Figure 5
Figure 5
Cholesterol-blended DNA-DDAB films. (A) Expected structural change of the cholesterol-doped films between the dry and wet states. Cholesterol is shown in pink, inserted between the DDAB aliphatic tails though both DNA and DDAB are able to switch. (B) SAXS spectra of dry films with varying amounts of cholesterol. (C) SAXS spectra of the same films in the wet state. Both sets of data indicate that the lamellar spacing of the films increases with increasing amounts of cholesterol. Peak ratios in the DNA base-pair and DDAB tail regions of dry cholesterol films (see Figure S11 in the Supporting Information) indicate that DDAB remains largely in a bilayer while DNA becomes more double-stranded with increasing amounts of cholesterol, presumably due to the increased retention of water by cholesterol in the film. (D) Variations in the DNA and DDAB peak ratios in their respective regions over time in a wetted 20% cholesterol film as it dried. K values for the process are approximately triple that of normal DNA-DDAB films. The grey line indicates time of addition of water.
Figure 6
Figure 6
Structural analysis of ethidium bromide-labeled films. (A) Expected structural change of the DNA-DDAB film with added ethidium bromide between the dry and wet states. Ethidium bromide is shown in green, intercalating between the DNA base-pairs in the wet state, while it associates both with the exposed hydrophobic DNA bases and DDAB tails in the dry state. (B) Photographs of aqueous solutions or suspensions of (top) DNA with varying amounts of ethidium bromide and (bottom) DNA-DDAB complexes labeled with ethidum bromide. The supernantant used in the UV-Vis studies to measure the amount of ethidium bromide intercalation is the liquid taken from the bottom row of suspensions (see Supporting Information, Figure S13). The numbers I-IX refer to varying percentages 0.05–12% ethidium bromide, respectively. (C) Decay in fluorescence over time of a wetted 6.4% ethidium bromide-labeled film as it dried, agreeing with earlier data that suggests DNA is double-stranded in the wet film and becomes single-stranded in the dry film, and thus can no longer intercalate ethidium bromide which can then no longer fluoresce. Curve fitting indicates that the decay is exponential. (D) Variations in the peak ratio of a 6.4% ethidium bromide wetted film as it dries over time fitted with an exponential curve equation. K values for both DNA and DDAB ratio decay are nearly identical to that of the normal DNA-DDAB films (see Figure 1). (E) SAXS spectra of wet films labeled with varying amounts of ethidium bromide. (F) SAXS spectra of the same films in the dry state.
Figure 7
Figure 7
Macroscopic swelling and degradation experiments of a cast film. The molecular transition between dry and wet films can also be observed in a thick film when the dry film is immersed in water, based on weight and size increase. (A) An increase of 155% in volume corresponds to the transition from the structure in dry state to the structure in wet state, which is the same percent increase in the lamellar spacing from the dry to wet film (2.8 to 4.4 nm), indicating a direct correlation between the macroscopic and nanoscopic film structure. The rate was determined with an exponential fit to y = 1.562 − 0.5528 e (−0.2147*time) which is comparable to the drying rate. (B-D) Fluorescent and white light images of an ethidium bromide-labeled film on top of which was added PBS buffer, causing the film to degrade. (B) White light microscope image of the area in which the buffer was added. (C) Fluorescent microscope image of the same region, showing the DNA aggregation (bright areas) separated from the DDAB (dark areas). (D) Close-up of the cracks at the edge of the PBS region, indicating step formation. (E) Analysis of the cracks in the film by AFM indicates that the film degrades layer by layer, as the steps are ~2.8 nm in height.

Similar articles

Cited by

References

    1. Neumann T, Gajria S, Tirrell M, Jaeger L. J Am Chem Soc. 2009;131:3440–3441. - PMC - PubMed
    1. Ijiro K, Okahata Y. J Chem Soc-Chem Commun. 1992:1339–1341.
    1. Hoshino Y, Tajima S, Nakayama H, Okahata Y. Macromol Rapid Commun. 2002;23:253–255.
    1. Radler JO, Koltover I, Salditt T, Safinya CR. Science. 1997;275:810–814. - PubMed
    1. Martin B, Aissaoui A, Sainlos M, Oudrhiri N, Hauchecorne M, Vigneron JP, Lehn JM, Lehn P. Gene Ther Mol Biol. 2003;7:273–289.

Publication types