. 2010 Jun 4;9(6):3135-45.
doi: 10.1021/pr100035b.

Quantitative phosphoproteomic analysis of T cell receptor signaling in diabetes prone and resistant mice

Affiliations

Quantitative phosphoproteomic analysis of T cell receptor signaling in diabetes prone and resistant mice

Leo K Iwai et al. J Proteome Res. .

Abstract

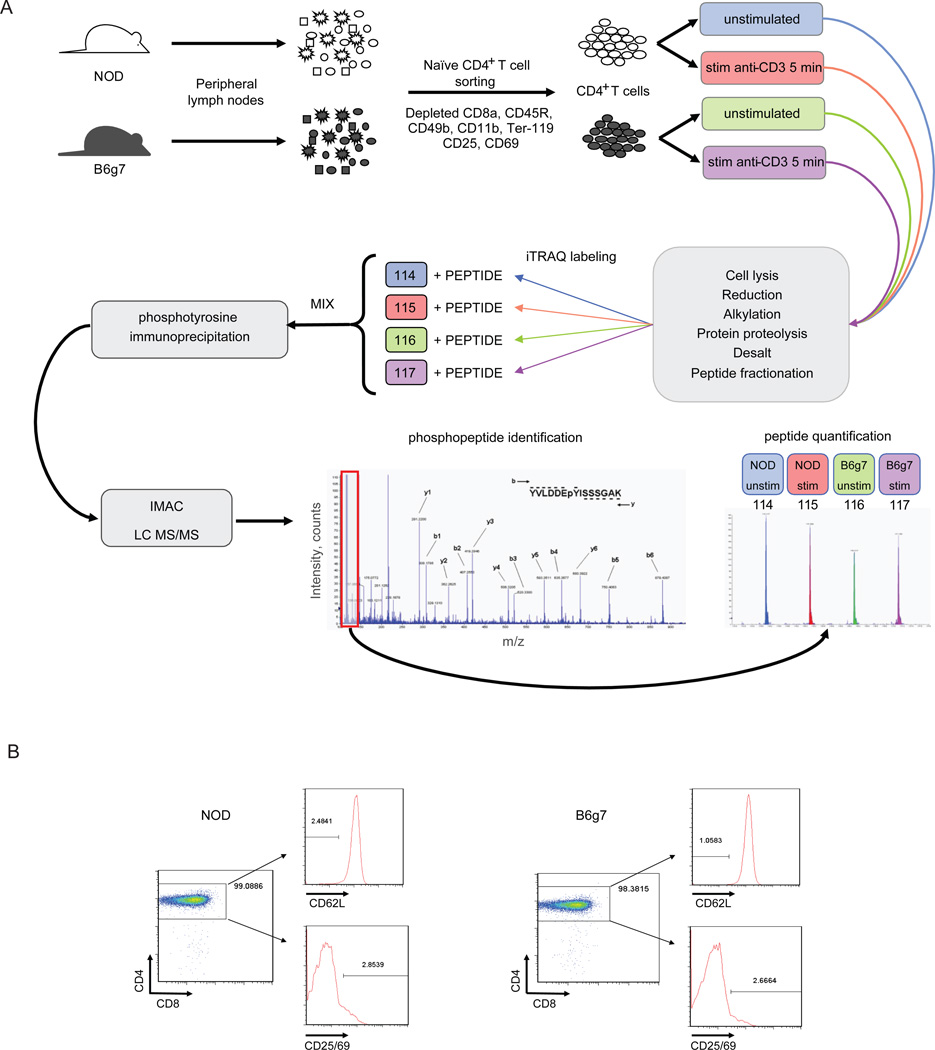
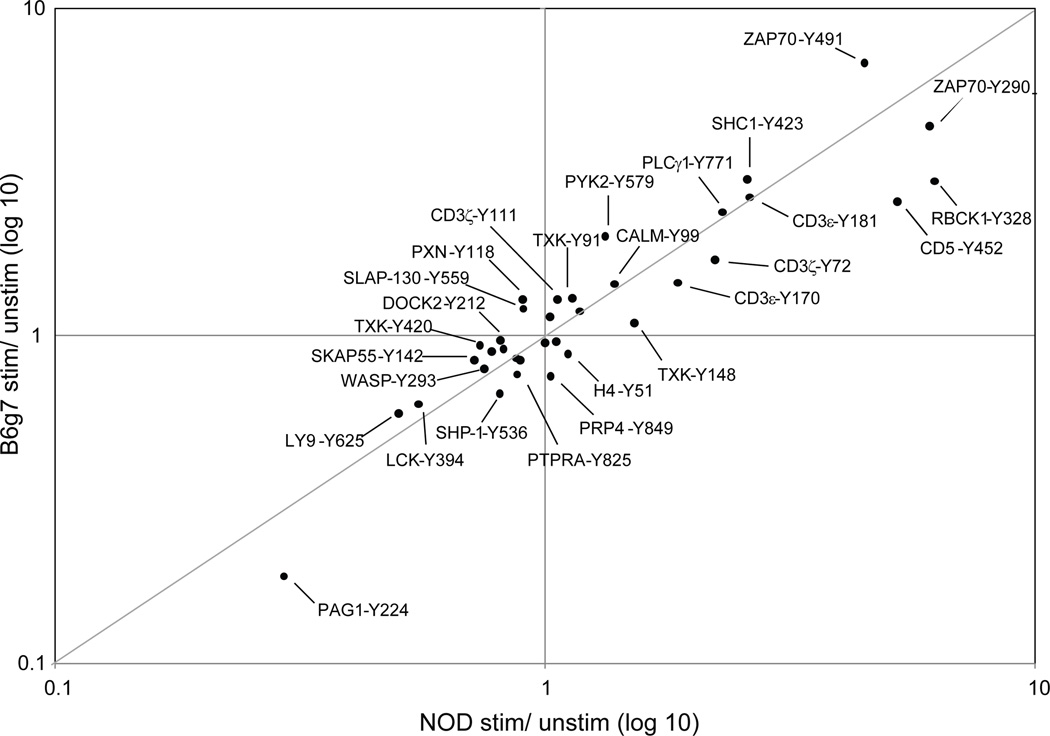
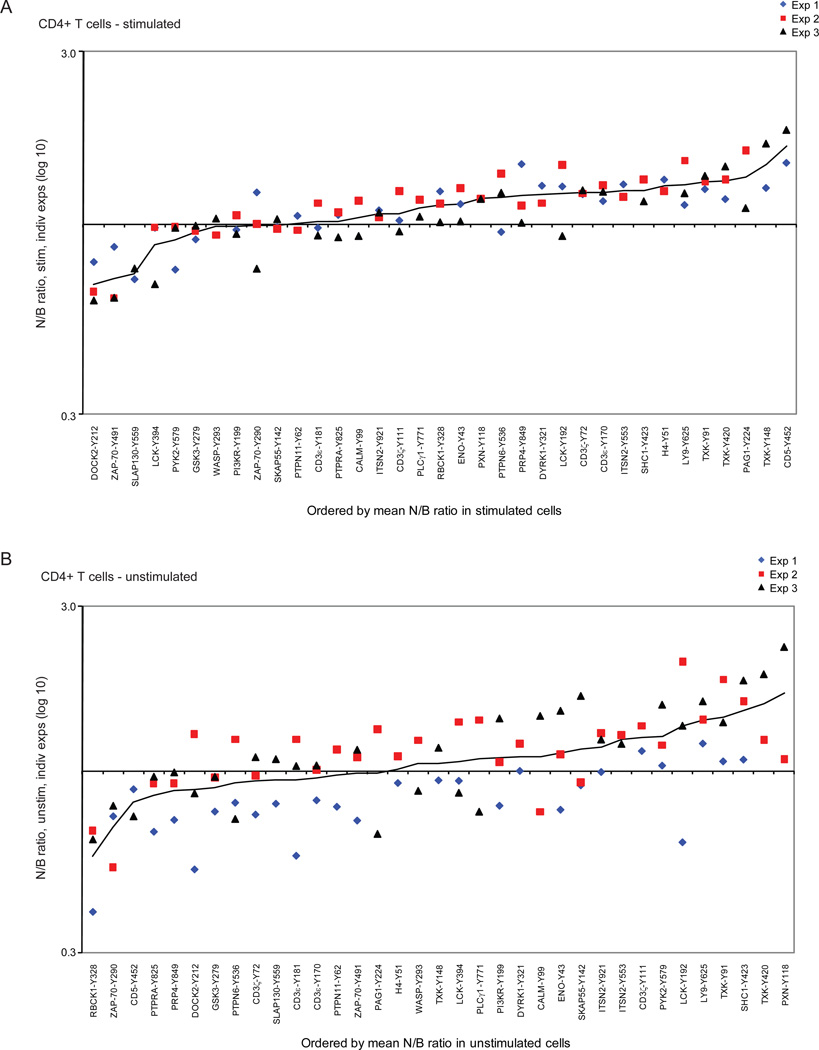
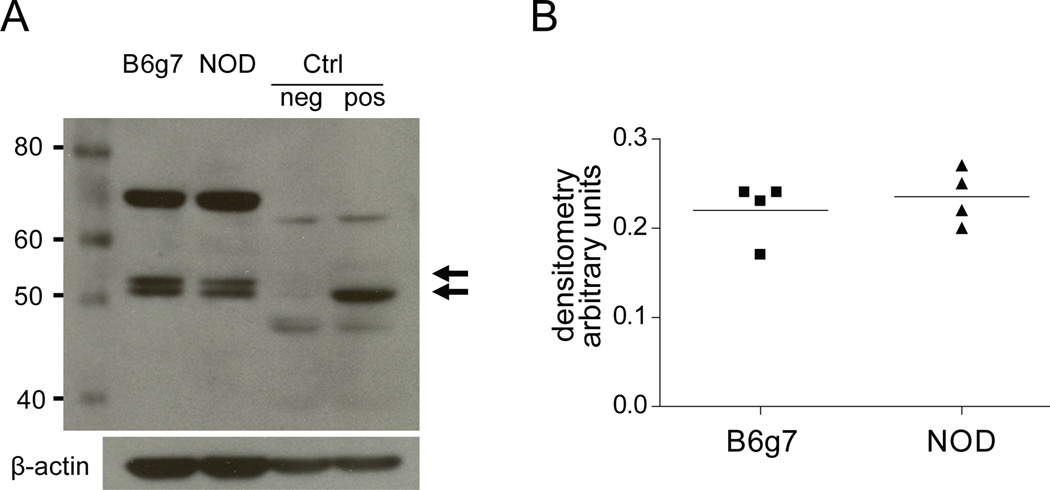
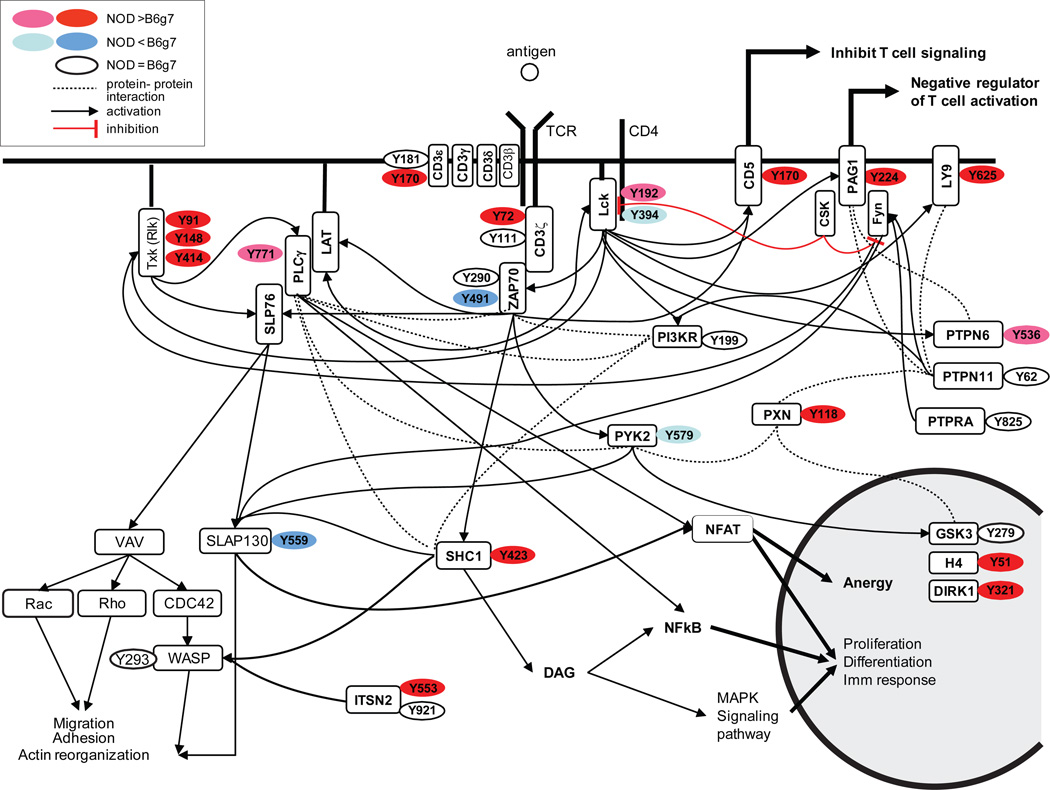
Type 1 diabetes, in human patients and NOD mice, results from an immune attack on insulin-producing beta-cells of the pancreas by autoreactive T lymphocytes. In NOD mice, genetically controlled perturbations in the signaling pathways downstream of the antigen-specific T cell receptor (TCR) may be instrumental in the altered responses of T cells, manifest as inefficient induction of apoptosis after recognition of self-antigens in the thymus or as perturbed reactivity of mature T cells in peripheral organs. To map this signaling difference(s), we have used mass spectrometry-based quantitative phosphoproteomics to compare the activation of primary CD4(+) T cells of diabetes-prone NOD and -resistant B6.H2g7 mice. Immunoprecipitation and IMAC purification of tyrosine-phosphorylated peptides, combined with a stable-isotope iTRAQ labeling, enabled us to identify and quantify over 77 phosphorylation events in 54 different proteins downstream of TCR stimulation of primary CD4(+) T cells. This analysis showed a generally higher level of phosphotyrosine in activated NOD cells, as well as several phosphorylation sites that appeared to be differentially regulated in these two strains (involving TXK, CD5, PAG1, and ZAP-70). These data highlight the differences in signaling between CD4(+) T cell compartments of NOD and B6g7 mice and may underlie the dysregulation of T cells in NOD mice.


Figures

Figure 1
Figure 1
A. Experimental scheme: subcutaneous lymph nodes were isolated from NOD and B6g7 mice and CD4+ T cells were magnetically separated by negative selection, thereby depleting non-CD4+ T cells using anti-CD8a, anti-CD45R, anti-CD49b, anti-CD11b and anti-Ter-119 to deplete CD8+ T cells, B cells, NK cells, macrophages, and erythroid cells, respectively. In addition preactivated or regulatory T cells were also depleted using anti-CD25 and anti-CD69 antibody. Half of the cells were left unstimulated and the other half was stimulated with anti-CD3 antibody for 5 min. Lysed cells were enzymatically digested, labeled separately with iTRAQ and combined. Upon phosphotyrosine enrichment by phosphotyrosine immunoprecipitation and IMAC, sample was subjected to LC-MS/MS analysis. Identification of each peptide was manually confirmed and quantification was performed by the analysis of the area from iTRAQ marker ions present in the MS/MS analysis. B. Assessment of CD4+ T cell separation analysis from both NOD and B6g7 subcutaneous lymph nodes by flow cytometry. CD4+ T cells separation were essentially >97%.
Figure 2
Figure 2
Heatmap and graphical clustering analysis of phosphotyrosine sites in unstimulated and stimulated CD4+ T cells from NOD and B6g7 mice. Clusters were classified into three major different categories: I. increased phosphorylation, II. decreased phosphorylation in both NOD and B6g7 upon treatment with anti-CD3 antibody, and III. peptides with minimal change during activation. Values in the table are normalized row-wise by the mean of all four conditions (unstimulated, stimulated; NOD and B6g7 mice) for each of the peptide. Heatmap color graduation varies from low (blue) to high (red) tyrosine phosphorylation. * The tryptic peptide containing pY394 could not be unambiguously assigned to LCK, SRC, FYN or YES because its sequence is identical among these Src kinase family members.
Figure 3
Figure 3
Quantification of tyrosine phosphorylation in B6g7 and NOD CD4+ T cells stimulated with anti-CD3 for 5 minutes. For each phosphorylated peptide, fold-change phosphorylation level was calculated for stimulated to unstimulated CD4+ T cells. Fold-change for B6g7 cells was then compared to fold-change for NOD cells to obtain the plot.
Figure 4
Figure 4
Comparison of tyrosine-phosphorylation in peripheral CD4+ T cells from diabetes-susceptible NOD vs. –resistant B6g7 mice (a) stimulated or (b) unstimulated with anti-CD3 antibody. Proteins plotted by order of the mean of NOD (N) over B6g7 (B) ratio. Different colors represent different experiments. Protein tyrosine-phosphorylation sites are represented by Y-position of phosphorylation.
Figure 5
Figure 5
a. One dimension western blotting analysis with anti-TXK antibody (1:1000) of B6g7 and NOD CD4+ T cell lysates and positive (+) and negative (−) controls (lysates of 293FT cell lines expressing or not TXK protein, respectively). Arrows show the two isoforms present in the mouse cell lysate. b. Densitometry quantification of the bands in B6g7 and NOD. Both 52 kDa and 57 kDa were merged.
Figure 6
Figure 6
T cell signaling pathways and protein phosphorylation sites identified to be differential between NOD and B6g7 mice in stimulated cells. In red: high tyrosine-phosphorylation upregulated in NOD; pink: low tyrosine-phosphorylation in NOD; blue: high tyrosine phosphorylation upregulated in B6g7; light blue: low tyrosine phosphorylation upregulated in B6g7; in white: tyrosine-phosphorylation equal in NOD and B6g7 (recompiled from KEGG Pathway database, Refs and ).

References

    1. Kikutani H, Makino S. The murine autoimmune diabetes model: NOD and related strains. Adv. Immunol. 1992;51:285–322. - PubMed
    1. Concannon P, Rich SS, Nepom GT. Genetics of type 1A diabetes. N. Engl. J. Med. 2009;360(16):1646–1654. - PubMed
    1. Barrett JC, Clayton DG, Concannon P, Akolkar B, Cooper JD, Erlich HA, Julier C, Morahan G, Nerup J, Nierras C, Plagnol V, Pociot F, Schuilenburg H, Smyth DJ, Stevens H, Todd JA, Walker NM, Rich SS. Genome-wide association study and meta-analysis find that over 40 loci affect risk of type 1 diabetes. Nat. Genet. 2009 - PMC - PubMed
    1. Bluestone JA, Tang Q, Sedwick CE. T Regulatory Cells in Autoimmune Diabetes: Past Challenges, Future Prospects. J Clin Immunol. 2008 - PubMed
    1. Kishimoto H, Sprent J. A defect in central tolerance in NOD mice. Nat. Immunol. 2001;2(11):1025–1031. - PubMed

Publication types