. 2010 Apr 29;11 Suppl 3(Suppl 3):S4.
doi: 10.1186/1471-2105-11-S3-S4.

A conformal Bayesian network for classification of Mycobacterium tuberculosis complex lineages

Affiliations

A conformal Bayesian network for classification of Mycobacterium tuberculosis complex lineages

Minoo Aminian et al. BMC Bioinformatics. .

Abstract

Background: We present a novel conformal Bayesian network (CBN) to classify strains of Mycobacterium tuberculosis Complex (MTBC) into six major genetic lineages based on two high-throuput biomarkers: mycobacterial interspersed repetitive units (MIRU) and spacer oligonucleotide typing (spoligotyping). MTBC is the causative agent of tuberculosis (TB), which remains one of the leading causes of disease and morbidity world-wide. DNA fingerprinting methods such as MIRU and spoligotyping are key components in the control and tracking of modern TB.

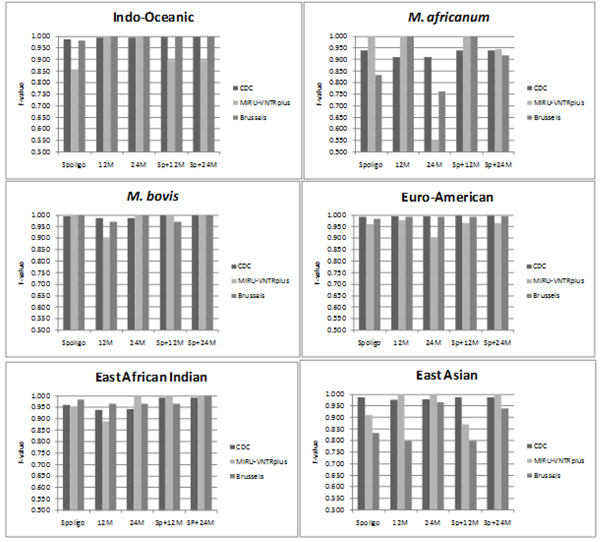
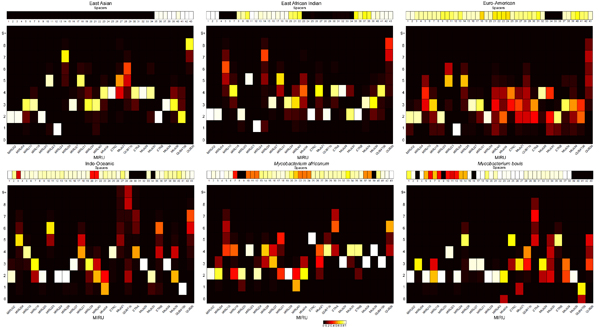
Results: CBN is designed to exploit background knowledge about MTBC biomarkers. It can be trained on large historical TB databases of various subsets of MTBC biomarkers. During TB control efforts not all biomarkers may be available. So, CBN is designed to predict the major lineage of isolates genotyped by any combination of the PCR-based typing methods: spoligotyping and MIRU typing. CBN achieves high accuracy on three large MTBC collections consisting of over 34,737 isolates genotyped by different combinations of spoligotypes, 12 loci of MIRU, and 24 loci of MIRU. CBN captures distinct MIRU and spoligotype signatures associated with each lineage, explaining its excellent performance. Visualization of MIRU and spoligotype signatures yields insight into both how the model works and the genetic diversity of MTBC.

Conclusions: CBN conforms to the available PCR-based biological markers and achieves high performance in identifying major lineages of MTBC. The method can be readily extended as new biomarkers are introduced for TB tracking and control. An online tool (http://www.cs.rpi.edu/~bennek/tbinsight/tblineage) makes the CBN model available for TB control and research efforts.


Figures

Figure 1
Figure 1
Hierarchical Bayesian network developed to predict TB major lineages using spoligotypes and MIRU. The model first uses M24 to distinguish modern versus ancestral lineages. The spacers and MIRU are treated as conditionally independent given the lineage. The unobserved variables formula image 
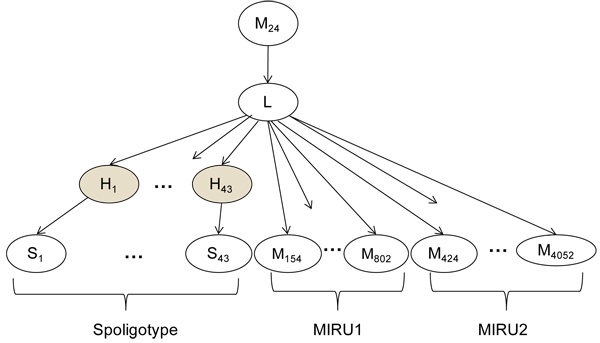
capture the fact that spacers are lost and almost never gained. The shaded nodes refer to hidden variables.
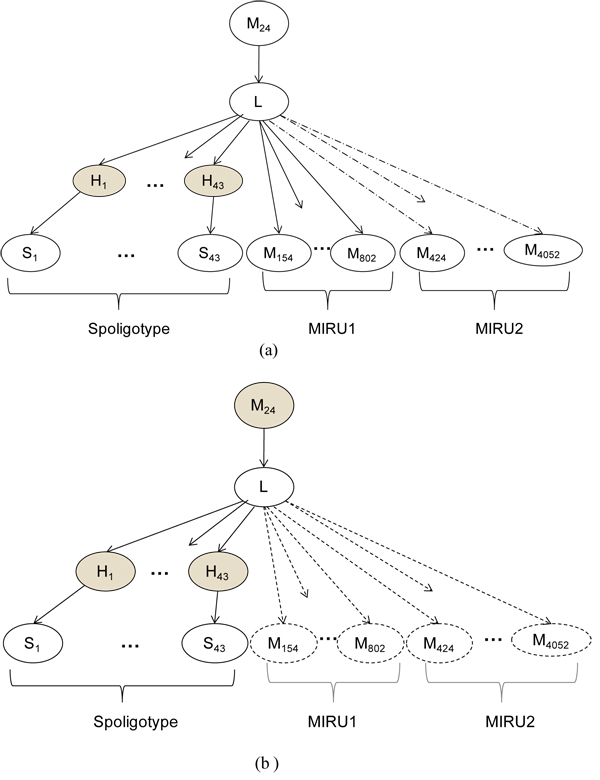
Figure 2
Figure 2
Conformal Bayesian network (CBN) using different combinations of spoligotypes and MIRUs. In (a) only spoligotypes and 12 loci of MIRU (MIRU1 + M24) are observed. The components of the network corresponding to the 12 loci of MIRU in MIRU2 are ignored as shown by the dotted lines. (b) CBN predicts using spoligotype only, treating M24 as a missing variable and ignoring all other MIRU portions of the network. The shaded nodes refer to hidden values in each case, and the nodes represented with dotted outlines are not used for prediction.
Figure 3
Figure 3
Comparison of F-values of predictions made by the CBN and TBN for all 6 lineages. Tests performed on 3 datasets (1) CDC using 10% stratified cross validation, (2) MIRU-VNTRplus, and (3) Brussels. CBN achieves equally good or better performance than TBN for all lineages on all datasets. The largest gains are seen on MIRU-VNTRplus and Brussels which have different distributions than the CDC dataset used for training.
Figure 4
Figure 4
CBN average F-value over all the lineages. F-values obtained by CBN using different combinations of biomarkers 1) Spoligotype alone (Spoligo) 2) 12-loci MIRU (12M) 3) 24-loci MIRU (24M) 4) Spoligotype + 12-loci MIRU (Sp+12M) and 5) Spoligotype + 24-loci MIRU (Sp+24M). Out-of-sample testing was done on CDC (using 10% stratified cross-validation), MIRU-VNTRplus and Brussels. In general, the performance improves when the spoligotype is used in conjunction with the MIRU profile as compared to using a single type of biomarker.
Figure 5
Figure 5
F-values of predictions averaged over all 6 lineages. 3 datasets were used: 1) CDC – with stratified sampling, 10% cross-validation 2) MIRU-VNTRplus and 3) Brussels. Results shown for all the combinations of bio-markers used: 1) Spoligotype alone (Spoligo) 2) 12-loci MIRU (12M) 3) 24-loci MIRU (24M) 4) Spoligotype + 12-loci MIRU (Sp+12M) and 5) Spoligotype + 24-loci MIRU (Sp+24M). Comparison shows that the overall performance improves when the spoligotype and MIRU are used in combination rather than individually. Improved performance is observed in most cases when 24-loci MIRU is used as compared to 12-loci MIRU.
Figure 6
Figure 6
Heat Map indicating probability distribution of spoligotype spacers and MIRU loci by lineage. The probability of a spacer being present at each of the 43 loci of the spoligotype is shown for each lineage. Each MIRU locus is modelled as a multinomial distribution with possible values 0, 1…8, and ≥ 9 (9+). In the MIRU heat map for each lineage, the X axis represents the MIRU loci, Y axis the number of tandem repeats, and each square represents the probability of occurrence of the number of repeats at the specified locus. The range of probability values from 0 to 1 are depicted by colors ranging from black to white.

References

    1. Kamerbeek J, Schouls L, Kolk A, vanAgterveld M, vanSoolingen D, Kuijper S, Bunschoten A, Molhuizen H, Shaw R, Goyal M. Simultaneous detection and strain differentiation of Mycobacterium tuberculosis for diagnosis and epidemiology. J Clin Microbiol. 1997;35(4):907–914. - PMC - PubMed
    1. Supply P, Allix C, Lesjean S, Cardoso-Oelemann M, Rusch-Gerdes S, Willery E, Savine E, de Haas P, van Deutekom H, Roring S. Proposal for standardization of optimized mycobacterial interspersed repetitive unit-variable-number tandem repeat typing of Mycobacterium tuberculosis. J Clin Microbiol. 2006;44(12):4498–4510. doi: 10.1128/JCM.01392-06. - DOI - PMC - PubMed
    1. Hirsh AE, Tsolaki AG, DeRiemer K, Feldman MW, Small PM. Stable association between strains of Mycobacterium tuberculosis and their human host populations. P Natl Acad Sci USA. 2004;101(14):4871–4876. doi: 10.1073/pnas.0305627101. - DOI - PMC - PubMed
    1. Ferdinand S, Valetudie G, Sola C, Rastogi N. Data mining of Mycobacterium tuberculosis complex genotyping results using mycobacterial interspersed repetitive units validates the clonal structure of spoligotyping-defined families. Res Microbiol. 2004;155(8):647–654. doi: 10.1016/j.resmic.2004.04.013. - DOI - PubMed
    1. Filliol I, Driscoll JR, van Soolingen D, Kreiswirth BN, Kremer K, Valetudie G, Anh DD, Barlow R, Banerjee D, Bifani PJ. Snapshot of moving and expanding clones of Mycobacterium tuberculosis and their global distribution assessed by spoligotyping in an international study. J Clin Microbiol. 2003;41(5):1963–1970. doi: 10.1128/JCM.41.5.1963-1970.2003. - DOI - PMC - PubMed

Publication types

LinkOut - more resources