. 2010 Jul;30(14):3531-41.
doi: 10.1128/MCB.00889-09. Epub 2010 May 3.

Pbx1 represses osteoblastogenesis by blocking Hoxa10-mediated recruitment of chromatin remodeling factors

Affiliations

Pbx1 represses osteoblastogenesis by blocking Hoxa10-mediated recruitment of chromatin remodeling factors

Jonathan A R Gordon et al. Mol Cell Biol. 2010 Jul.

Abstract

Abdominal-class homeodomain-containing (Hox) factors form multimeric complexes with TALE-class homeodomain proteins (Pbx, Meis) to regulate tissue morphogenesis and skeletal development. Here we have established that Pbx1 negatively regulates Hoxa10-mediated gene transcription in mesenchymal cells and identified components of a Pbx1 complex associated with genes in osteoblasts. Expression of Pbx1 impaired osteogenic commitment of C3H10T1/2 multipotent cells and differentiation of MC3T3-E1 preosteoblasts. Conversely, targeted depletion of Pbx1 by short hairpin RNA (shRNA) increased expression of osteoblast-related genes. Studies using wild-type and mutated osteocalcin and Bsp promoters revealed that Pbx1 acts through a Pbx-binding site that is required to attenuate gene activation by Hoxa10. Chromatin-associated Pbx1 and Hoxa10 were present at osteoblast-related gene promoters preceding gene expression, but only Hoxa10 was associated with these promoters during transcription. Our results show that Pbx1 is associated with histone deacetylases normally linked with chromatin inactivation. Loss of Pbx1 from osteoblast promoters in differentiated osteoblasts was associated with increased histone acetylation and CBP/p300 recruitment, as well as decreased H3K9 methylation. We propose that Pbx1 plays a central role in attenuating the ability of Hoxa10 to activate osteoblast-related genes in order to establish temporal regulation of gene expression during osteogenesis.


Figures
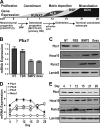
FIG. 1.
FIG. 1.
Pbx1 expression decreases during osteoblast differentiation. (A) Schematic illustrating temporal gene expression during osteoblast differentiation. Osteoblast-like differentiation was induced in C3H10T1/2 cells by treatment with either 2% FBS (control), 100 ng/ml BMP2, or 10 nM dexamethasone for 7 days. (B) Relative mRNA expression of Pbx1 in C3H10T1/2 cells was determined by RT-qPCR. (C) Protein expression was determined by Western blotting using an anti-Pbx1 antibody. MC3T-3E1 cells were treated with 280 μM ascorbic acid-5 mM β-glycerol phosphate to induce osteogenic differentiation for a total period of 28 days. (D) Total RNA was isolated, and relative expression of TALE protein family genes was determined by real-time quantitative PCR using gene-specific primers. (E) Relative protein expression of Pbx1 over the 28-day time course was determined by Western blotting using an anti-Pbx1 antibody. Error bars indicate SEM.
FIG. 2.
FIG. 2.
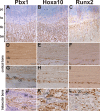
Pbx1 is expressed in bone but not in mature osteoblasts. Two-day-old mouse long bones were demineralized and stained for Pbx1, Hoxa10, or Runx2 as indicated. (A, B, and C) Mouse femur region displaying proliferating chondrocytes (pc), trabecular bone (tb), bone marrow (bm), and hypertrophic chondrocytes (hc). (D, E, and F) Cortical bone demonstrating muscle (m), periosteal region (p), and mature bone (b). Scale bar, 200 μm. (G to L) High-magnification images (scale bars, 50 μm) for cortical bone with adjacent periosteum and muscle, showing fibrous capsule (fc), osteoprogenitors (op) with robust Pbx1 staining, and mature osteoblasts (ob) (G, H, and I), and for trabecular bone, demonstrating newly formed bone (nb) with many osteoprogenitors (op) surrounding calcified cartilage (cc) (J, K, and L).
FIG. 3.
FIG. 3.
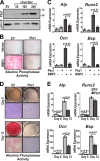
Overexpression of Pbx1 results in decreased expression of osteoblast-related genes in mesenchymal progenitor cells. (A) C3H10T1/2 cells were infected with several concentrations (∼50, 100, and 200 PFU/cell) of recombinant lentivirus encoding Pbx1. Relative expression of Pbx1 was determined by Western blotting using an anti-Pbx1 antibody (N-20; Santa Cruz) followed by detection with anti-rabbit-horseradish peroxidase (HRP)/ECL reagent. (B) and C) C3H10T1/2 cells were infected with ∼100 PFU/cell of recombinant lentivirus (EV or Pbx1). Cells were then treated with BMP2 or vehicle (PBS) for 7 days. (B) C3H10T1/2 cells overexpressing Pbx1 demonstrated less alkaline phosphatase activity. Scale bar, 500 μm. (C) Total RNA was isolated from C3H10T1/2 cells, and relative expression of osteoblast-related genes was determined by RT-qPCR using gene-specific primers. (D and E) MC3T3-E1 cells were infected with ∼100 PFU/cell of recombinant lentivirus (EV or Pbx1) and treated with 280 μM ascorbic acid-5 mM β-glycerol phosphate to induce osteogenic differentiation for a period of 6 and 12 days. (D) MC3T3-E1 cells were fixed and stained for alkaline phosphatase activity. (E) Total RNA was isolated from MC3T3-E1 cells, and relative expression of osteoblast-related genes was determined by RT-qPCR using gene-specific primers. Statistical significance was determined by one-way ANOVA followed by a Bonferroni posttest. Data are presented as the means from three experiments ± SEM.
FIG. 4.
FIG. 4.
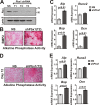
Depletion of Pbx1 by shRNA results in increased expression of osteoblast-related genes in mesenchymal cells. (A) to C) C3H10T1/2 cells were infected with ∼100 PFU/cell of shRNA-encoding recombinant lentivirus (nonsilencing [NS] or three different Pbx1-specific targets [T1, T2, and T3]). C3H10T1/2 cells were then treated with 100 ng/ml BMP2 or vehicle (PBS) for a period of 7 days. (A) Relative protein levels of Pbx1 in treated C3H10T1/2 cells were determined by Western blotting using an anti-Pbx1 antibody. (B) C3H10T1/2 cells treated with Pbx1-shRNA, demonstrating increased alkaline phosphatase activity. Scale bar, 500 μm. (C) Relative expression of osteoblast-related genes, monitored by RT-qPCR, was significantly increased in Pbx1-shRNA-infected C3H10T1/2 cells. (D and E) MC3T3-E1 cells were infected with shRNA-containing lentivirus (as described above) and treated with 280 μM ascorbic acid-5 mM β-glycerol phosphate for a period of 12 days to induce osteogenesis. (D) MC3T3-E1 cells treated with Pbx1-shRNA demonstrated increased alkaline phosphatase activity. (E) Relative expression of osteoblast-related genes in MC3T3-E1 cells was determined by RT-qPCR. Statistical significance was determined by one-way ANOVA followed by a Bonferroni posttest. Data are presented as the means from three experiments ± SEM.
FIG. 5.
FIG. 5.
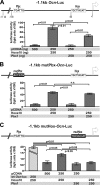
Alteration of Pbx1 consensus sequence in the osteocalcin promoter results in decreased attenuation of Hoxa10 activity. MC3T3E1 preosteoblasts were transfected with 500 ng of the indicated luciferase reporter plasmids as well as the indicated amounts (ng) of pCDNA3, pCDNA-Hoxa10, and/or pCDNA-Pbx1, and relative luciferase activity was assessed with a luminometer. (A) Luciferase reporter construct (pGL3-Basic) containing the −1.1-kb region of rat Ocn (−1.1 kb Ocn-Luc). Hoxa10-mediated luciferase reporter activity was significantly decreased upon cotransfection of Pbx1. (B and C) The −1.1-kb Ocn-luc plasmid was modified by site-directed mutagenesis to alter the putative Pbx1 DNA consensus sequence (−1.1 kb mutPbx-Ocn-Luc) or the Hox DNA consensus sequence (−1.1 kb mutHox-Ocn-Luc). (B) Alteration of the Pbx1 DNA consensus sequence resulted in loss of Pbx1 repression of Hoxa10-mediated Ocn-luciferase activity. (C) Alteration of Hox sequence resulted in a significant decrease in Ocn-driven luciferase activity and no significant activation in the presence of Pbx1. Statistical significance was determined by two-way ANOVA followed by a Bonferroni posttest. Data are presented as the means from three experiments ± SEM.
FIG. 6.
FIG. 6.
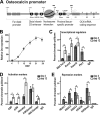
Pbx1 displays a pattern of gene-repressive functionality on the osteocalcin promoter. (A) Diagram of rat osteocalcin promoter displaying relative binding sites and primer sites used for chromatin immunoprecipitation analysis. Rat calvarial osteoblasts were isolated from embryonic day 18.5 rat pups and collected during the proliferative stage (day 4) or cultured in differentiating conditions and collected during exponential increase in osteocalcin expression (day 12). (B) Calvarial osteoblasts were analyzed at the indicated differentiation stages by RT-qPCR to determine levels of osteocalcin gene expression. (C to E) The ChIP analysis was performed on cleared lysates from primary osteoblasts using ∼5 μg of the indicated antibody. Recovered DNA was then quantified by qPCR using primers specific for the proximal promoter region of the osteocalcin gene to determine relative occupancy of transcriptional activators (C), activation markers (D), or repressive markers (E). Statistical significance was determined by Student's t test (*, P < 0.05 versus matched control). ChIP experiments were repeated at least two times with similar results, and one representative experiment is presented (± standard deviation [SD]).
FIG. 7.
FIG. 7.
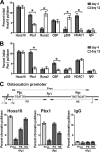
Pbx1 cooccupancy with repressive histone-modifying enzymes and Hoxa10 on the osteocalcin promoter in proliferating cells. Cross-linked cell lysates from primary calvarial osteoblasts were immunoprecipitated using either anti-Hoxa10 or anti-Pbx1 antibody, and the resulting fraction was further immunoprecipitated using the specified antibodies (ChIP-reChIP). (A) The Hoxa10-immunoprecipitated fraction was further immunoprecipitated using Hoxa10, Runx2, Pbx1, CBP, p300, HDAC1, or control (IgG) antibodies and quantified by qPCR. (B) The Pbx1-immunoprecipitated fraction was further immunoprecipitated using Hoxa10, Runx2, Pbx1, CBP, p300, HDAC1, or control (IgG) antibodies and quantified by qPCR. (C) Cross-linked chromatin from proliferating calvarial osteoblasts was treated with PstI to cleave DNA between the Hoxa10- and Pbx1-binding sites, immunoprecipitated with anti-Hoxa10 or anti-Pbx1 antibody, and evaluated with primer sets specific for digested (Pbx site [PS] or Hox site [HS]) or undigested (proximal promoter [Prox]) fragments. Statistical significance was determined by Student's t test (*, P < 0.05 versus matched control). the ChIP experiment was repeated three times with similar results, and the data presented are from one representative experiment (± SD).
FIG. 8.
FIG. 8.
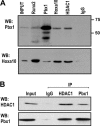
Pbx1 protein-protein interactions in osteoblasts. (A) Whole-cell lysates from confluent MC3T3-E1 cells were immunoprecipitated with Hoxa10, Runx2, Pbx1, HDAC1, or control (IgG) antibodies. Proteins were resolved by SDS-PAGE, and Hoxa10 and Pbx1 were detected by Western blotting with specific antibodies. (B) Lysates from MC3T3-E1 were used for immunoprecipitation using anti-HDAC1 followed by Western blotting with anti-Pbx1 or specific HDAC antibody.
FIG. 9.
FIG. 9.
Modification of Pbx1 levels in osteoblasts results in alteration of histone-modifying enzymes at the osteocalcin promoter. (A and B) Rat calvarial osteoblasts were isolated from embryonic day 18.5 rat pups and infected with Pbx1 or empty (EV) lentiviral constructs, and cells were collected at 48 h after infection after just reaching confluence (day 6). (A) Relative expression of the Pbx1 and Ocn genes was monitored by RT-qPCR. (B) ChIP analysis was performed on cleared lysates from primary osteoblasts using ∼5 μg of the indicated antibody. Recovered DNA was then quantified by qPCR using primers specific for the proximal promoter region of the osteocalcin gene to determine the relative occupancy of the indicated proteins. (C) Isolated osteoblasts (as described above) were infected with Pbx1-shRNA or nonsilencing shRNA (NS) lentiviral constructs, and relative expression of Pbx1 and Ocn was determined by RT-qPCR. (D) ChIP analysis was performed on cleared lysates from treated primary osteoblasts (as described above) to determine the relative occupancy of the indicated proteins on the osteocalcin promoter. Statistical significance was de- termined by Student's t test (*, P < 0.05 versus matched control). ChIP experiments were repeated two times with similar results, and the data presented are representative of one experiment (± SD). (E) Schematic model of Pbx-mediated repression of the osteocalcin gene.

Similar articles

Cited by

References

    1. Allen, T. D., Y. X. Zhu, T. S. Hawley, and R. G. Hawley. 2000. TALE homeoproteins as HOX11-interacting partners in T-cell leukemia. Leuk. Lymphoma 39:241-256. - PubMed
    1. Balint, E., D. Lapointe, H. Drissi, C. van der Meijden, D. W. Young, A. J. van Wijnen, J. L. Stein, G. S. Stein, and J. B. Lian. 2003. Phenotype discovery by gene expression profiling: mapping of biological processes linked to BMP-2-mediated osteoblast differentiation. J. Cell. Biochem. 89:401-426. - PubMed
    1. Bei, L., Y. Lu, S. L. Bellis, W. Zhou, E. Horvath, and E. A. Eklund. 2007. Identification of a HoxA10 activation domain necessary for transcription of the gene encoding beta3 integrin during myeloid differentiation. J. Biol. Chem. 282:16846-16859. - PubMed
    1. Berkes, C. A., D. A. Bergstrom, B. H. Penn, K. J. Seaver, P. S. Knoepfler, and S. J. Tapscott. 2004. Pbx marks genes for activation by MyoD indicating a role for a homeodomain protein in establishing myogenic potential. Mol. Cell 14:465-477. - PubMed
    1. Canalis, E., V. Deregowski, R. C. Pereira, and E. Gazzerro. 2005. Signals that determine the fate of osteoblastic cells. J. Endocrinol. Invest. 28:3-7. - PubMed

Publication types

MeSH terms