. 2010 May 10;207(5):1057-66.
doi: 10.1084/jem.20090849. Epub 2010 May 3.

TNF suppresses acute intestinal inflammation by inducing local glucocorticoid synthesis

Affiliations

TNF suppresses acute intestinal inflammation by inducing local glucocorticoid synthesis

Mario Noti et al. J Exp Med. .

Abstract

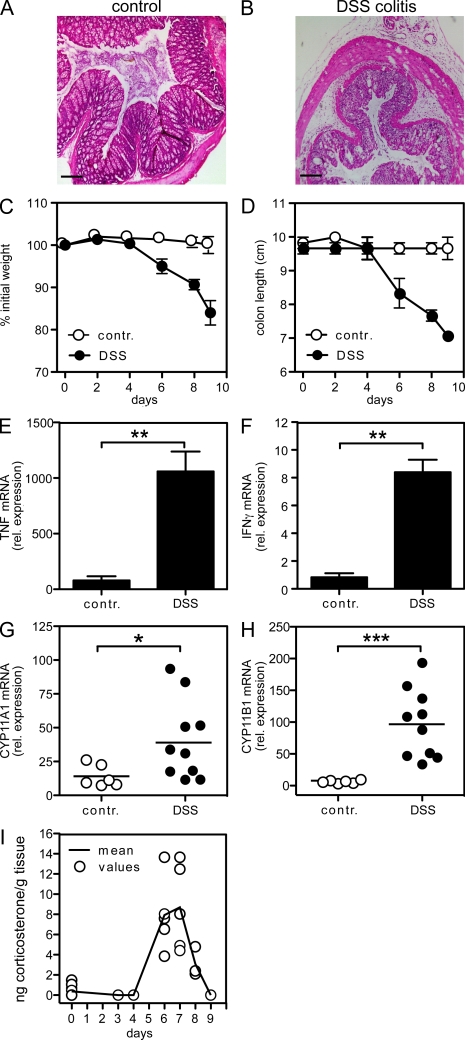
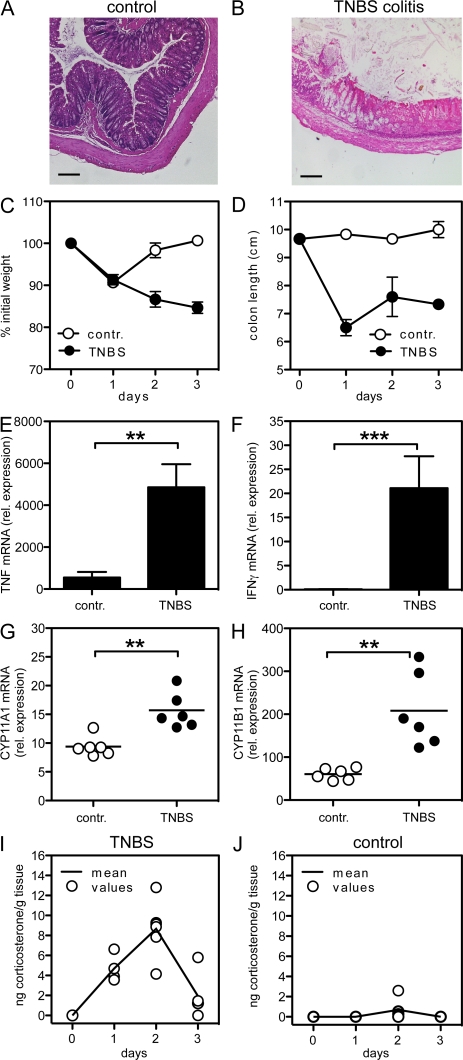
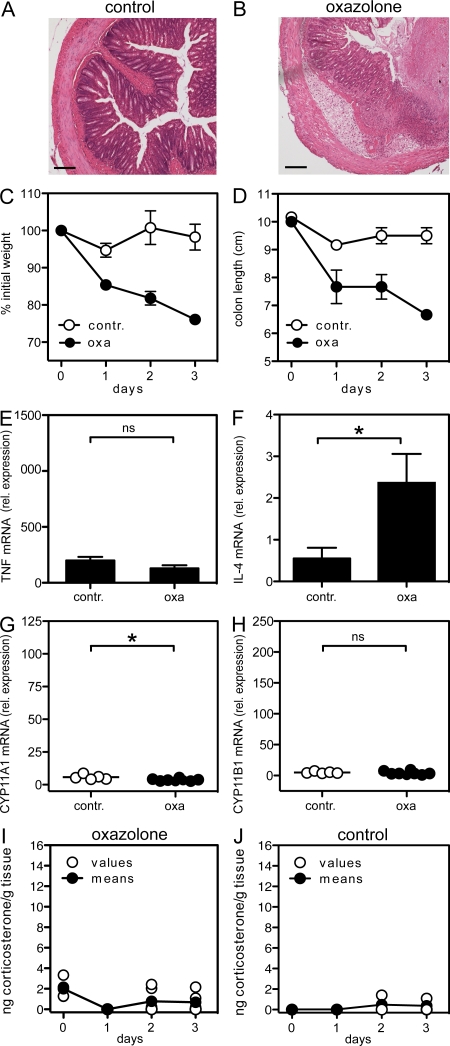
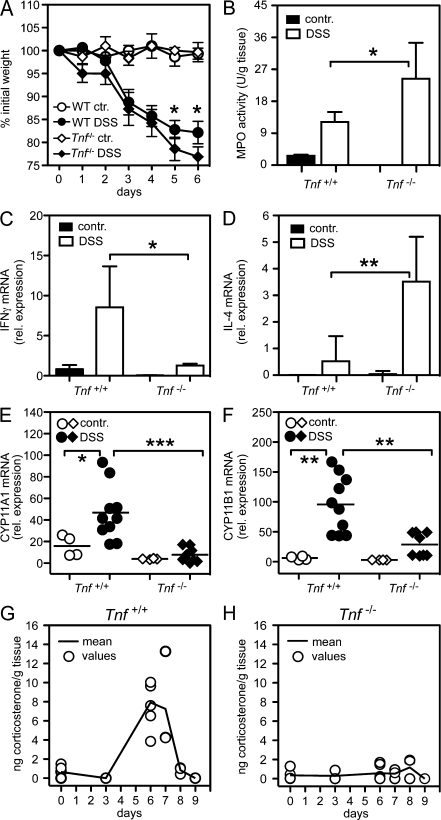
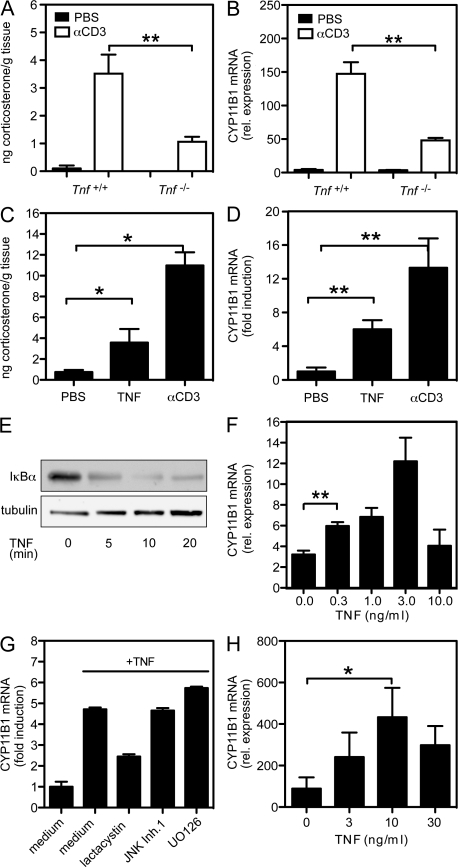
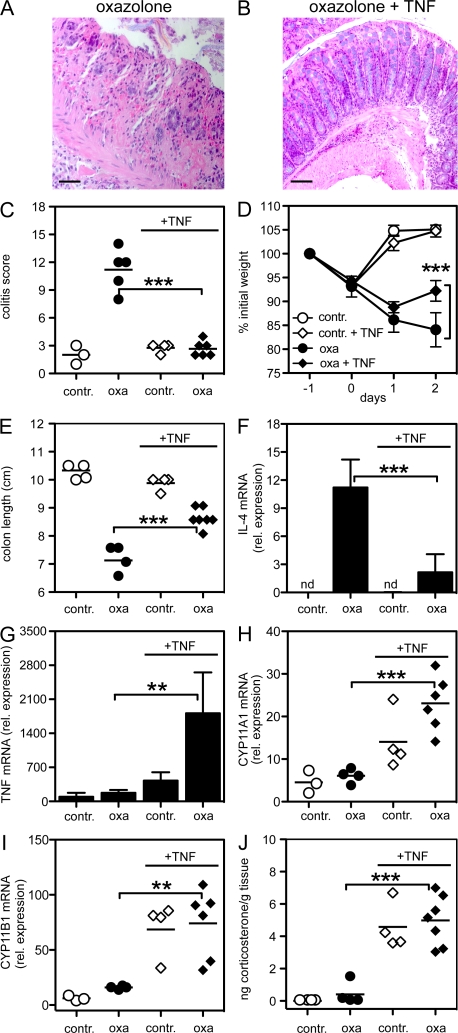
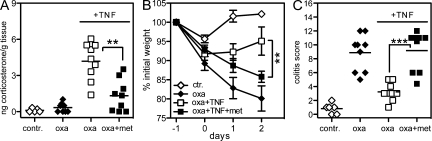
Although tumor necrosis factor (alpha) (TNF) exerts proinflammatory activities in a variety of diseases, including inflammatory bowel disease, there is increasing evidence for antiinflammatory actions of TNF. In contrast, glucocorticoids (GCs) are steroid hormones that suppress inflammation, at least in part by regulating the expression and action of TNF. We report that TNF induces extraadrenal production of immunoregulatory GCs in the intestinal mucosa during acute intestinal inflammation. The absence of TNF results in a lack of colonic GC synthesis and exacerbation of dextran sodium sulfate-induced colitis. TNF seems to promote local steroidogenesis by directly inducing steroidogenic enzymes in intestinal epithelial cells. Therapeutic administration of TNF induces GC synthesis in oxazolone-induced colitis and ameliorates intestinal inflammation, whereas inhibition of intestinal GC synthesis abrogates the therapeutic effect of TNF. These data show that TNF suppresses the pathogenesis of acute intestinal inflammation by promoting local steroidogenesis.


Figures

Figure 1.
Figure 1.
DSS-induced colitis and intestinal GC synthesis. Mice were control treated or colitis was induced by 3% DSS in drinking water. (A and B) Histology of colon from control mice (A) or colitogenic mice (B) at day 9. (C and D) Time course of weight loss (C) and colon length (D) in control- and DSS-treated mice. Means ± SD are shown (n = 5 per group). (E and F) Expression of TNF (E) and IFN-γ (F) in control- and DSS-treated mice at day 7. Means ± SD are shown (n = 5 per group). (G and H) Expression of the steroidogenic enzymes CYP11A1 (G) and CYP11B1 (H) in control-treated and colitogenic mice at day 7. Mean and individual values of 6–10 mice per group are shown. (I) Time course of GC synthesis in colonic organ cultures of DSS-treated mice. Mean values and individual values of two to six mice per time point are shown. *, P < 0.05; **, P < 0.01; ***, P < 0.005. Pooled data are from three independent experiments. Bars, 100 µm.
Figure 2.
Figure 2.
TNBS-induced Th1 colitis and intestinal GC synthesis. (A and B) Histology of control- (A) and TNBS-treated (B) mice at day 3. (C and D) Time course of weight loss (C) and colon length (D) in control- and TNBS-treated mice. Means ± SD are shown (n = 5 per group). (E and F) Expression of TNF (E) and IFN-γ (F) in control- and TNBS-treated mice at day 2. Means ± SD are shown (n = 5 per group). (G and H) Expression of the steroidogenic enzymes CYP11A1 (G) and CYP11B1 (H) in control- and TNBS-treated mice at day 2. Mean and individual values of five to six mice per group are shown. (I and J) Time course of GC synthesis in colonic organ cultures of TNBS- (I) and control-treated mice (J). Mean and individual values of two to six mice per time point are shown. **, P < 0.01; ***, P < 0.005. Pooled data are from three independent experiments. Bars, 100 µm.
Figure 3.
Figure 3.
Oxazolone-induced Th2 colitis and intestinal GC synthesis. (A and B) Histology of control- (A) and oxazolone-treated (B) mice at day 3. (C and D) Time course of weight loss (C) and colon length (D) in control- and oxazolone-treated mice. Means ± SD are shown (n = 5 per group). (E and F) Expression of TNF (E) and IL-4 (F) in control- and oxazolone-treated mice at day 2. Means ± SD are shown (n = 5 per group). (G and H) Expression of the steroidogenic enzymes CYP11A1 (G) and CYP11B1 (H) in control- and oxazolone-treated mice at day 2. Mean and individual values of five to eight mice per group are shown. (I and J) Time course of GC synthesis in colonic organ cultures of oxazolone- (I) and control-treated mice (J). Mean and individual values of three to five mice per time point are shown. *, P < 0.05. Pooled data are from three independent experiments. ns, not significant. Bars, 100 µm.
Figure 4.
Figure 4.
TNF is required for DSS colitis–induced GC synthesis. (A) Kinetic of weight loss in control- or DSS-treated wild-type (TNF+/+) or TNF−/− mice. (B) MPO activity in colonic tissue from control- or DSS-treated TNF+/+ or TNF−/− mice. (C and D) Expression of IFN-γ (C) and IL-4 (D) in control or colitogenic mice. Means ± SD of five mice per group are shown. (E and F) Expression of CYP11A1 (E) and CYP11B1 (F) in colonic tissue from control- or DSS-treated TNF+/+ or TNF−/− mice at day 6. Mean and individual values of 4–10 mice per group are shown. *, P < 0.05; **, P < 0.01; ***, P < 0.005. (G and H) Kinetic of corticosterone synthesis in colonic tissue from DSS-treated TNF+/+ and TNF−/− mice. Mean and individual values of three to four mice per time point are shown. One typical experiment out of two is shown.
Figure 5.
Figure 5.
Role of TNF in anti-CD3–induced intestinal GC synthesis. (A) TNF+/+ or TNF−/− mice were injected i.p. with PBS control or anti-CD3 antibody, and corticosterone production in colonic organ cultures was assessed. (B) CYP11B1 expression in colonic tissue from PBS- and anti-CD3–treated TNF+/+ or TNF−/− mice. (C) Corticosterone synthesis in colonic organ culture from control-treated (PBS) mice or mice that were injected with recombinant TNF or anti-CD3 antibody. (D) Mice were treated as in C and CYP11B1 expression was measured in colonic tissue. Means ± SD from five mice per group are shown. *, P < 0.05; **, P < 0.01. (E) YAMCs were stimulated with TNF for the indicated time points and IκB degradation was assessed by Western blotting. (F) Cells were stimulated with increasing concentrations of TNF for 6 h and CYP11B1 expression was analyzed. (G) YAMCs were pretreated with medium control, lactacystin, JNK inhibitor 1, or the MAP kinase inhibitor U0126 before stimulation with TNF. CYP11B1 expression was analyzed after 6 h by real-time PCR. (H) Primary colonic epithelial cells were stimulated for 4 h with TNF, and CYP11B1 mRNA expression levels were measured by quantitative PCR. One typical experiment out of three is shown.
Figure 6.
Figure 6.
Administration of TNF restores intestinal GC synthesis and protects from oxazolone-induced colitis. Colitis was induced by intrarectal administration of ethanol control or oxazolone. Mice were then treated daily with buffer control or TNF. (A and B) Histology of colonic tissue of mice with oxazolone colitis (A) or oxazolone colitis treated with TNF. (C) Analysis of histological alterations (colitis score) in the colonic tissue of mice treated with oxazolone and/or TNF. (D and E) Time course of weight loss (D) and colon length (E) in control- and oxazolone-treated mice with or without TNF therapy. (F and G) IL-4 (F) and TNF (G) mRNA expression in colonic tissue. (H and I) Expression of the steroidogenic enzymes CYP11A1 (H) and CYP11B1 (I). (J) GC synthesis in ex vivo colonic organ cultures. All parameters were measured at day 2. Symbols represent values of individual mice; horizontal bars indicate mean values. In some experiments, means ± SD are shown (n = 4–7 mice per group). *, P < 0.05; **, P < 0.01; ***, P < 0.005. One typical experiment out of three is shown. Bars, 100 µm.
Figure 7.
Figure 7.
Inhibition of intestinal GC synthesis abrogates the antiinflammatory effect of TNF. Colitis was induced by intrarectal administration of ethanol control or oxazolone. Mice were then treated daily with buffer control or TNF, and intestinal GC synthesis was blocked by administration of metyrapone. (A) Corticosterone synthesis in ex vivo colonic organ cultures. (B) Kinetic of body weight loss. (C) Analysis of histological alterations (colitis score) in colonic tissue of mice treated with ethanol as control, oxazolone alone, oxazolone + TNF, and oxazolone + TNF + metyrapone. Means ± SD are shown (n = 6–9 animals per group). **, P < 0.01; ***, P < 0.005. One typical experiment out of three is shown.

References

    1. Atanasov A.G., Leiser D., Roesselet C., Noti M., Corazza N., Schoonjans K., Brunner T. 2008. Cell cycle-dependent regulation of extra-adrenal glucocorticoid synthesis in murine intestinal epithelial cells. FASEB J. 22:4117–4125 10.1096/fj.08-114157 - DOI - PubMed
    1. Botrugno O.A., Fayard E., Annicotte J.S., Haby C., Brennan T., Wendling O., Tanaka T., Kodama T., Thomas W., Auwerx J., et al. 2004. Synergy between LRH-1 and beta-catenin induces G1 cyclin-mediated cell proliferation. Mol. Cell. 15:499–509 - PubMed
    1. Cima I., Corazza N., Dick B., Fuhrer A., Herren S., Jakob S., Ayuni E., Mueller C., Brunner T. 2004. Intestinal epithelial cells synthesize glucocorticoids and regulate T cell activation. J. Exp. Med. 200:1635–1646 10.1084/jem.20031958 - DOI - PMC - PubMed
    1. Corazza N., Eichenberger S., Eugster H.P., Mueller C. 1999. Nonlymphocyte-derived tumor necrosis factor is required for induction of colitis in recombination activating gene (RAG)2−/− mice upon transfer of CD4+CD45RBhi T cells. J. Exp. Med. 190:1479–1492 10.1084/jem.190.10.1479 - DOI - PMC - PubMed
    1. Corazza N., Brunner T., Buri C., Rihs S., Imboden M.A., Seibold I., Mueller C. 2004. Transmembrane tumor necrosis factor is a potent inducer of colitis even in the absence of its secreted form. Gastroenterology. 127:816–825 10.1053/j.gastro.2004.06.036 - DOI - PubMed

Publication types

MeSH terms

Substances