Case Reports
. 2010 May;92(5):1231-40.
doi: 10.2106/JBJS.I.00594.

Derivation and characterization of an extra-axial chordoma cell line (EACH-1) from a scapular tumor

Affiliations
Case Reports

Derivation and characterization of an extra-axial chordoma cell line (EACH-1) from a scapular tumor

Amalia M DeComas et al. J Bone Joint Surg Am. 2010 May.

Abstract

Background: Extra-axial chordomas are rare low-grade malignant tumors thought to arise from notochordal remnants in the extra-axial skeleton. Few studies have been done on this neoplasm because of its rarity. In addition, there is a lack of a good in vitro model on which to perform more characterization.

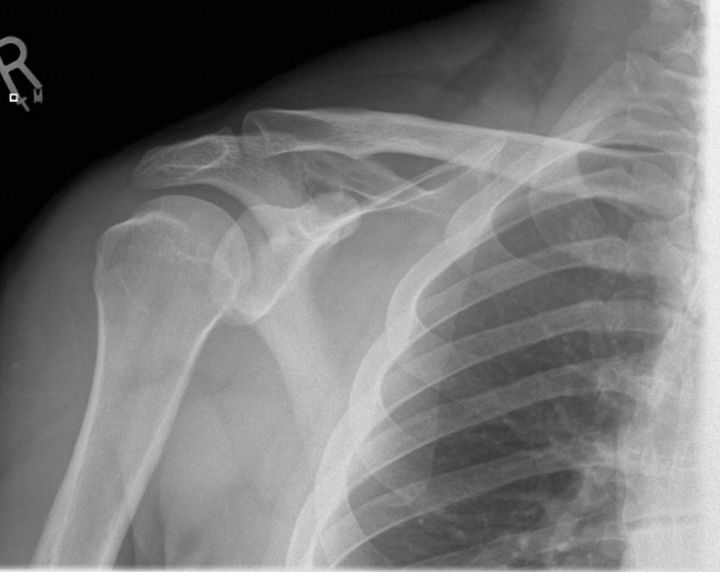
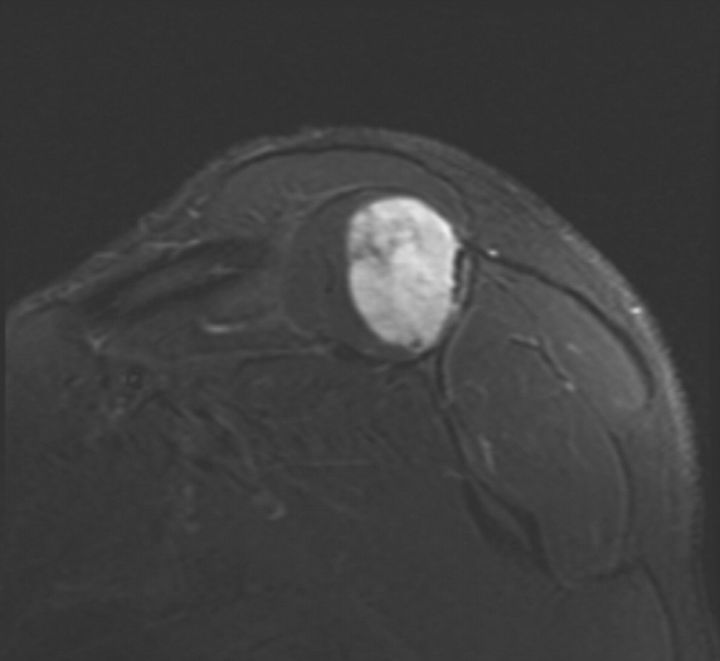
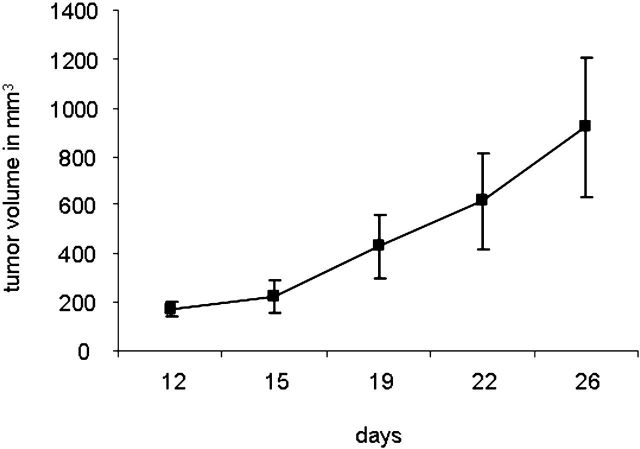
Methods: We describe a twenty-eight-year-old man with a mass in the right scapula. Cytomorphology and immunohistochemistry, including brachyury staining, were used to formulate the final diagnosis. A fragment of the tumor was placed in culture, and cells obtained were injected subcutaneously in an immunocompromised mouse. From the tumor developed in mice, a cell line has been derived and characterized by fluorescence-activated cell-sorting analysis, karyotyping, clonogenicity, and cell and tumor growth curves.

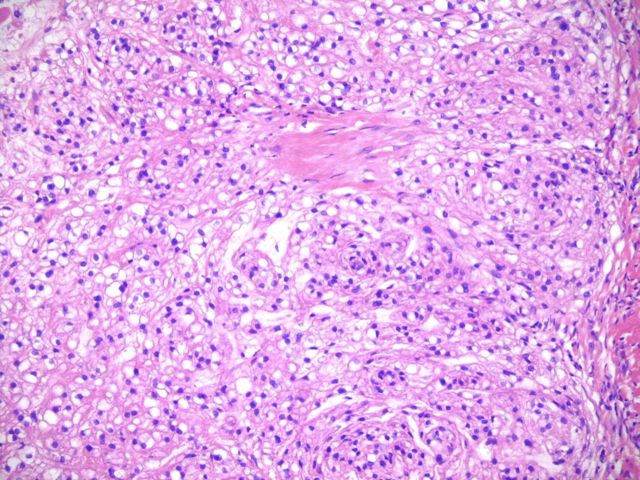
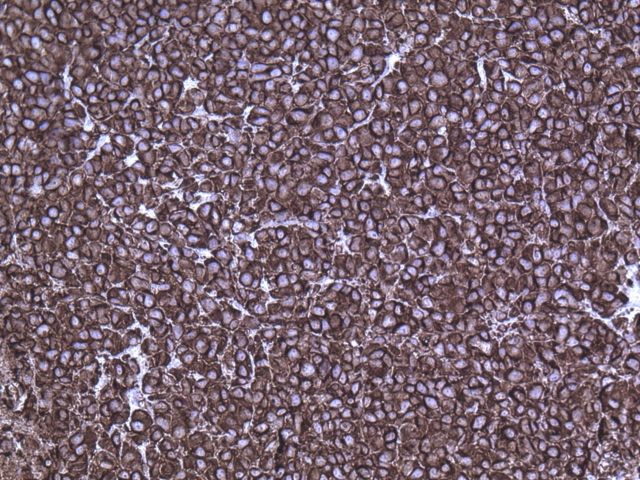
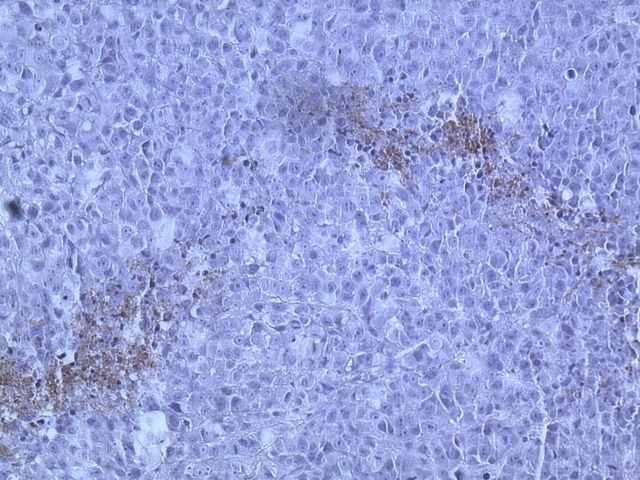
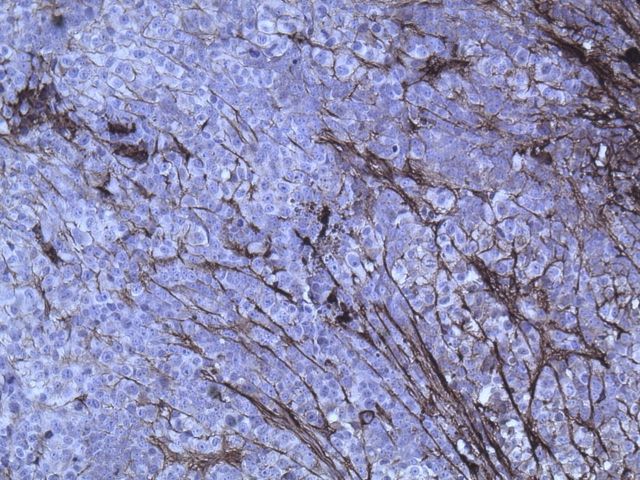
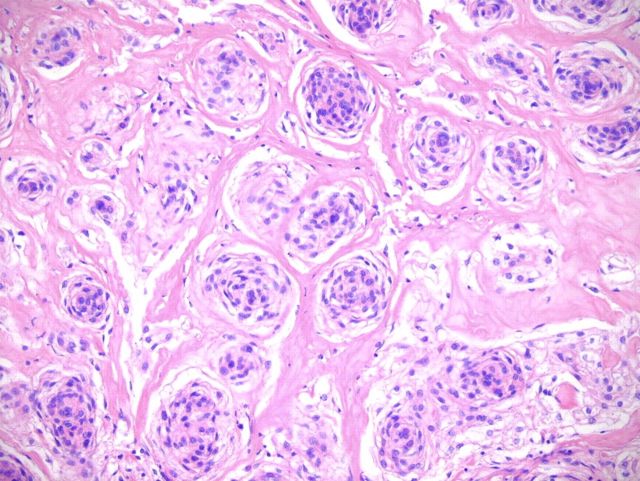
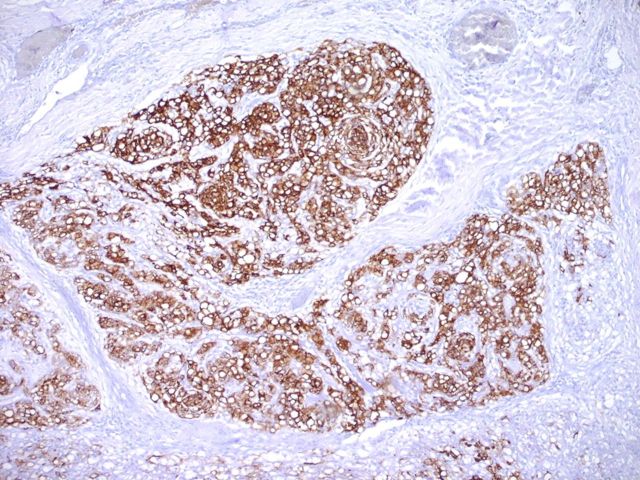
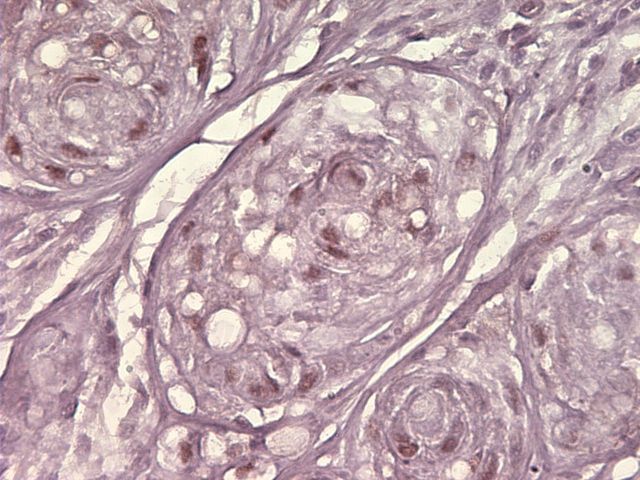
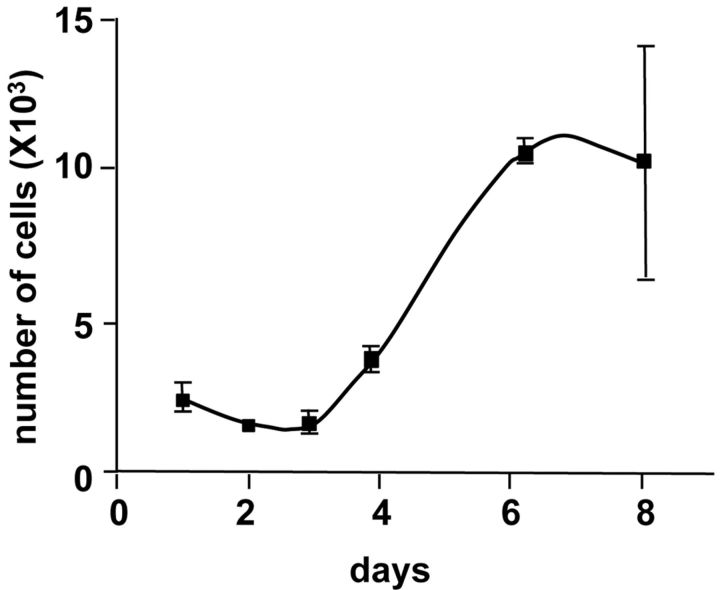
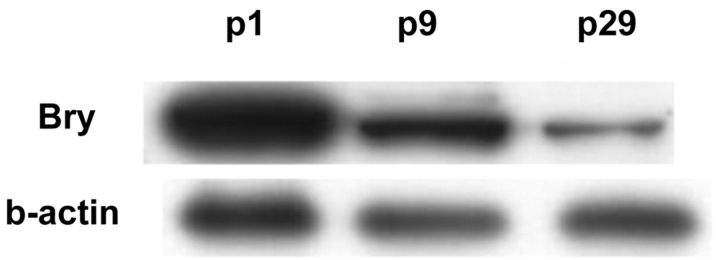
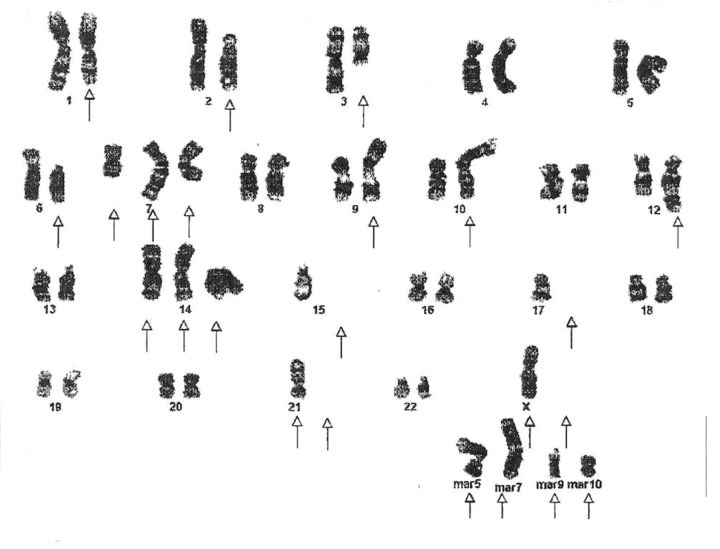
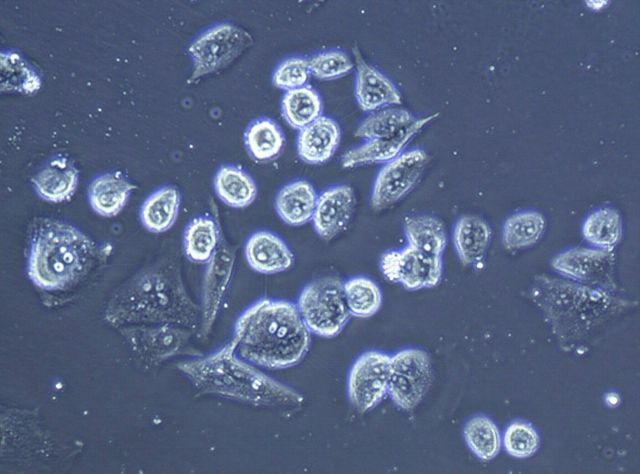
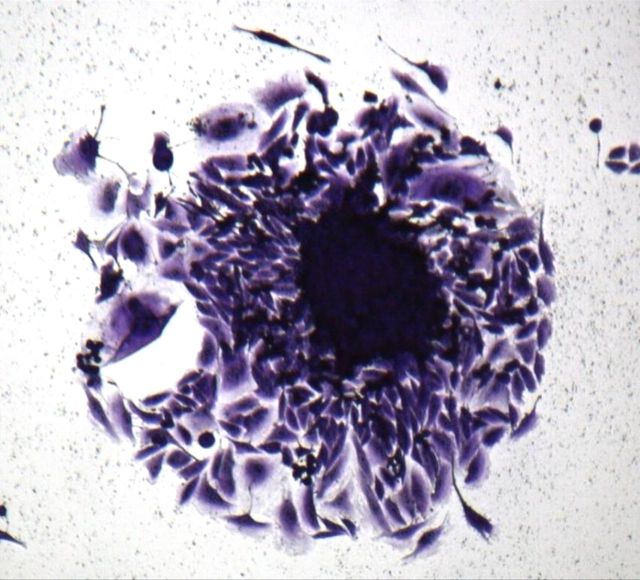
Results: Cytomorphology on the tumor showed nests of round cells with vacuoles and also physaliferous-like cells with uniform nuclei. Immunochemistry revealed a tumor positive for vimentin, moderately positive for S-100 and cytokeratin AE1/AE3, weakly positive for epithelial membrane antigen, and negative for p63 and cytokeratin (CK)-7. Further analysis revealed the tumor was diffusely and strongly positive for brachyury. The cell line derived from the tumor showed rapid doubling-time, a strong expression of mesenchymal cell surface markers, a karyotype of diploid or hypotetraploid clones with numerous chromosomal aberrations, and the ability to form colonies without attachment and to form tumors in immunocompromised mice.

Conclusions: The diagnosis of the extra-axial chordoma is difficult but can be resolved by the detection of a strong brachyury expression. In addition, the derivation of a human extra-axial chordoma cell line could be a useful tool for the basic research of this rare neoplasm.


Figures

None
Fig. 1-A Fig. 1-B
Fig. 1-A An anteroposterior radiograph of the right shoulder, showing a subtle destructive pattern within the scapular body. Fig. 1-B A coronal slice of a STIR sequence (short T1/Tau Inversion Recovery) magnetic resonance image of the shoulder, showing a partially enhancing solid mass within the belly of the right supraspinatus muscle. It was well circumscribed and measured 6.6 × 4.7 × 3.4 cm. The mass exhibits markedly high intensity on the STIR sequence.
None
Fig. 2-A Fig. 2-B Fig. 2-C Fig. 2-D Fig. 2-E Fig. 2-F
Hematoxylin and eosin staining of a tumor biopsy specimen (Fig. 2-A). Immunostaining for vimentin (Fig. 2-B), S-100 (Fig. 2-C), and cytokeratin AE1/AE3 (Fig. 2-D) (×10 for all). Hematoxylin and eosin staining of the resected tumor at 20× magnification (Fig. 2-E) and at 80× magnification (Fig. 2-F).
None
Fig. 3-A Fig. 3-B
Fig. 3-A Epithelial membrane antigen immunostaining (×20). Fig. 3-B Brachyury immunostaining (×80).
None
Fig. 3-A Fig. 3-B
Fig. 3-A Epithelial membrane antigen immunostaining (×20). Fig. 3-B Brachyury immunostaining (×80).
None
Fig. 4-A Fig. 4-B
Fig. 4-A Growth curve of EACH-1 cell line from three cultures. Error bars indicate the standard deviation. Fig. 4-B Western blot analysis of EACH-1 cell line at passage 1, 9, and 29 for brachyury (Bry) protein expression. β-actin is used as internal loading control.
None
Fig. 4-A Fig. 4-B
Fig. 4-A Growth curve of EACH-1 cell line from three cultures. Error bars indicate the standard deviation. Fig. 4-B Western blot analysis of EACH-1 cell line at passage 1, 9, and 29 for brachyury (Bry) protein expression. β-actin is used as internal loading control.
None
Fig. 5-A Fig. 5-B
Karyotypes of two distinct clones (Figs. 5-A and 5-B) from the EACH-1 cell line.
None
Fig. 5-A Fig. 5-B
Karyotypes of two distinct clones (Figs. 5-A and 5-B) from the EACH-1 cell line.
None
Fig. 6-A Fig. 6-B Fig. 6-C
Fig. 6-A The left panel shows the morphology of EACH-1 cells (×200), and the right panel shows formation of a colony from soft agar assay (×100). Fig. 6-B The clonogenicity score after six and twelve days of culture in suspension. The errors bars represent the standard deviation. Fig. 6-C Tumor growth curve after subcutaneous injection of ten million EACH-1 cells in three nu/nu mice. The error bars represent the standard deviation.

References

    1. Bjornsson J Wold LE Ebersold MJ Laws ER. Chordoma of the mobile spine. A clinicopathologic analysis of 40 patients. Cancer. 1993;71:735-40. - PubMed
    1. McMaster ML Goldstein AM Bromley CM Ishibe N Parry DM. Chordoma: incidence and survival patterns in the United States, 1973-1995. Cancer Causes Control. 2001;12:1-11. - PubMed
    1. Heffelfinger MJ Dahlin DC MacCarty CS Beabout JW. Chordomas and cartilaginous tumors at the skull base. Cancer. 1973;32:410-20. - PubMed
    1. Folpe AL Agoff SN Willis J Weiss SW. Parachordoma is immunohistochemically and cytogenetically distinct from axial chordoma and extraskeletal myxoid chondrosarcoma. Am J Surg Pathol. 1999;23:1059-67. - PubMed
    1. Kilpatrick SE Hitchcock MG Kraus MD Calonje E Fletcher CD. Mixed tumors and myoepitheliomas of soft tissue: a clinicopathologic study of 19 cases with a unifying concept. Am J Surg Pathol. 1997;21:13-22. - PubMed

Publication types