

Comment
. 2010 May 25;107(21):E86-7; author reply E88-9.
doi: 10.1073/pnas.1002725107.
Epub 2010 May 3.
Evidence for a recent increase in forest growth is questionable
- PMID: 20439700
- PMCID: PMC2906856
- DOI: 10.1073/pnas.1002725107
Item in Clipboard
Comment
Evidence for a recent increase in forest growth is questionable
Proc Natl Acad Sci U S A.
.
No abstract available
Conflict of interest statement
The authors declare no conflict of interest.
Figures
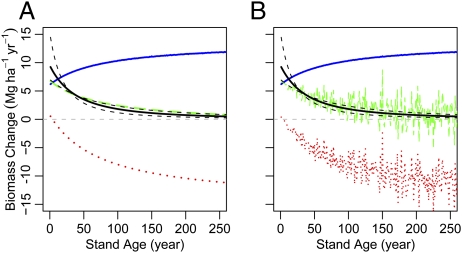
(A) Derivative of McMahon et al.’s (1) AGB model (black) with 95% CIs (black dashes) (table 2 in ref. 1). We calculated above-ground net primary productivity (growth; blue) as a function of AGB using equations derived from Forest Inventory and Analysis plot data for the Mid-Atlantic states region (figure 9 in ref. 4). We estimated biomass lost to mortality assuming a constant annual mortality rate of 2.1% (3) of ensemble AGB (red dotted line). The sum of growth and mortality gives us an estimate of biomass change (green dashes), which corresponds with the authors’ model and confirms the definition of  (1). We note that temporal variability in either mortality or growth rates could cause point estimates of from census plots to deviate from the model CIs. (B) To illustrate this, we allow the mortality rate to vary randomly over time, assuming that it is ~(0.021,0.005) We find that varying mortality rates (red) cause the observed (green) to frequently fall outside of the model expectations (black lines). If mortality rates decline to 1% for remeasurement intervals similar to those cited by McMahon et al. (1), the resulting
  s exceed the upper confidence bound by approximately the amount observed by the authors (3–4 Mg·ha−1·yr−1).
(1). We note that temporal variability in either mortality or growth rates could cause point estimates of from census plots to deviate from the model CIs. (B) To illustrate this, we allow the mortality rate to vary randomly over time, assuming that it is ~(0.021,0.005) We find that varying mortality rates (red) cause the observed (green) to frequently fall outside of the model expectations (black lines). If mortality rates decline to 1% for remeasurement intervals similar to those cited by McMahon et al. (1), the resulting s exceed the upper confidence bound by approximately the amount observed by the authors (3–4 Mg·ha−1·yr−1).Comment on
-
Evidence for a recent increase in forest growth.Proc Natl Acad Sci U S A. 2010 Feb 23;107(8):3611-5. doi: 10.1073/pnas.0912376107. Epub 2010 Feb 3. Proc Natl Acad Sci U S A. 2010. PMID: 20133710 Free PMC article.
References
-
- Clark JS, Mohan J, Dietze M, Ibanez I. Coexistence: How to identify trophic trade-offs. Ecology. 2003;84:17–31.
-
- Caspersen JP, et al. Contributions of land-use history to carbon accumulation in U.S. forests. Science. 2000;290:1148–1151. - PubMed
-
- Jenkins JC, Birdsey RA, Pan Y. Biomass and NPP estimation for the Mid-Atlantic region (USA) using plot-level forest inventory data. Ecol Appl. 2001;11:1174–1193.
-
- Bormann FH, Likens GE. Pattern and Process in a Forested Ecosystem. New York: Springer; 1979. pp. 164–191.
Publication types
MeSH terms
Substances
LinkOut - more resources
Full Text Sources
