

doi: 10.1073/pnas.0913745107.
Epub 2010 May 3.
Peptide antagonism as a mechanism for NK cell activation
Affiliations
- PMID: 20439706
- PMCID: PMC2890497
- DOI: 10.1073/pnas.0913745107
Item in Clipboard
Peptide antagonism as a mechanism for NK cell activation
Proc Natl Acad Sci U S A.
.
Abstract
Inhibition of natural killer (NK) cells is mediated by MHC class I receptors including the killer cell Ig-like receptor (KIR). We demonstrate that HLA-C binding peptides can function as altered peptide ligands for KIR and antagonize the inhibition mediated by KIR2DL2/KIR2DL3. Antagonistic peptides promote clustering of KIR at the interface of effector and target cells, but do not result in inhibition of NK cells. Our data show that, as for T cells, small changes in the peptide content of MHC class I can regulate NK cell activity.
Conflict of interest statement
The authors declare no conflict of interest.
Figures
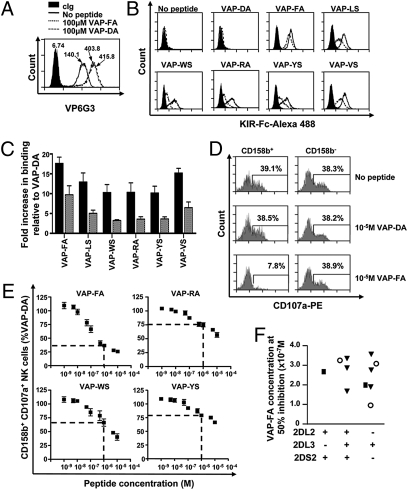
Comparison of KIR binding and NK cell inhibition for peptide variants. (A) Stabilization of HLA-Cw*0102 on T2 cells as determined by VP6G3 in the absence of peptide or with peptides VAP-FA and VAP-DA at 100 μM as determined by flow cytometry. MFI values are shown. (B) Flow cytometry histograms of the binding of KIR-Fc to T2 cells in the absence or presence of 100 μM of the indicated peptides. Cells were stained with 60 μg/mL isotype control (KIR2DS4-Fc; filled histogram), KIR2DL2-Fc (solid line), or KIR2DL3-Fc (dashed line) fusion proteins conjugated to protein-A Alexa-488. (C) The relative increase, as determined by flow cytometry, in KIR2DL2-Fc (black bar) or KIR2DL3-Fc (gray bar) binding to HLA-Cw*0102 stabilized with 100 μM of the indicated peptides compared with 100 μM VAP-DA. KIR-Fc was used at 60 μg/mL The means ± SEM of three independent experiments are shown. (D) Degranulation of NK cells in response to T2 cells in the absence or presence of 10 μM indicated peptide. Histogram plots are gated on CD3−CD56+CD158b+ or CD3−CD56+CD158b− NK cells. The frequency of degranulating NK cells is shown for each subset. (E) CD3−CD56+CD158b+ NK cell degranulation to T2 targets incubated with increasing concentrations of the indicated peptides. Data are normalized to degranulation in response to T2 cells incubated with VAP-DA and the level of inhibition at 1 μM peptide is indicated by a dashed line. No inhibition of CD3−CD56+CD158b− NK cells was observed. The percentage of CD158b+CD107a+ NK cells normalized to VAP-DA and the means ± SEM of three independent experiments are shown. (F) The peptide concentration required to inhibit 50% NK cells relative to VAP-DA for 11 donors with different KIR haplotypes. Squares indicate individuals with two group 2 HLA-C allotypes; circles, two group 1 HLA-C allotypes; and triangles, one group 1 and one group 2 HLA-C allotype.
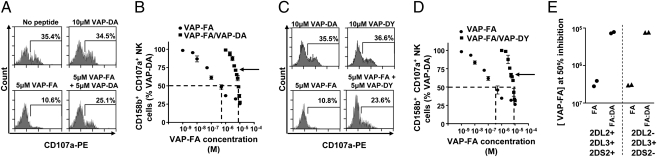
A weak KIR-binding peptide can disrupt inhibition by a strong KIR-binding peptide. (A) Degranulation of CD3−CD56+CD158b+ NK cells in response to T2 cells alone or incubated with VAP-DA and VAP-FA alone or in combination. (B) The fraction of degranulating CD3−CD56+CD158b+ NK cells in response to T2 cells incubated with different concentrations of VAP-FA alone or in combination with VAP-DA. Degranulation of CD3−CD56+CD158b+ NK cells in response to VAP-FA and VAP-DY alone or in combination shown as flow cytometry plots (C) or titrations (D). For the peptide mix experiments, different ratios of VAP-FA and VAP-DA or VAP-FA and VAP-DY starting at 10% VAP-FA/90% VAP-DA or 10% VAP-FA/90% VAP-DY, finishing at 100% VAP-FA, and varying by 10%, are shown. The final total peptide concentration in these mixes was fixed at 10 μM. Data are normalized to the degranulation in response to T2 cells incubated with 10 μM VAP-DA, and the dashed line indicates the concentration of VAP-FA at which 50% of NK cells are inhibited relative to VAP-DA. The means ± SEM of three independent experiments are shown for each peptide. (E) Concentration of VAP-FA at which 50% inhibition values were obtained for four donors with different KIR genotypes. Shown are the values for VAP-FA alone (FA) or for VAP-FA and VAP-DA (FA:DA).
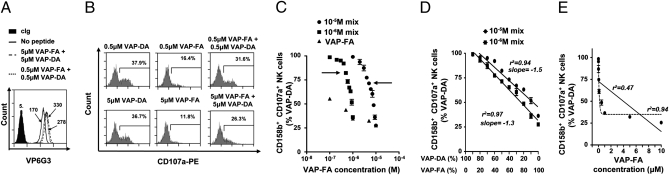
The ratio of strong to weak KIR-binding peptide determines the change in inhibition. (A) Stabilization of HLA-Cw*0102 on T2 cells in the absence or presence of 1 μM or 10 μM peptide. (B) Degranulation of CD3−CD56+CD158b+ NK cells in response to T2 cells alone or incubated with a single peptide or a combination of VAP-DA and VAP-FA at 1 μM or 10 μM final. (C) Fraction of degranulating CD3−CD56+CD158b+ NK cells in response to T2 cells incubated with VAP-FA alone or in combination with VAP-DA. The peptide mixes tested consisted of different ratios of VAP-FA and VAP-DA, from 10% VAP-FA/90% VAP-DA to 100% VAP-FA, and differing by 10%, to a final total peptide concentration of 1 μM or 10 μM. Data are normalized to the degranulation observed in response to T2 cells incubated with 10 μM VAP-DA and represent the means ± SEM of three independent experiments. Arrows indicate the 50% VAP-FA point. (D) shows a linear regression of the data from C plotted as the fraction of degranulating CD3−CD56+CD158b+ NK cells against the ratio of VAP-FA to VAP-DA in the peptide mix. (E) Regression analyses for the peptide titration of VAP-FA alone. The full line indicates a linear regression and the dashed line a one-phase decay nonlinear regression. Correlation coefficients for both analyses are shown.
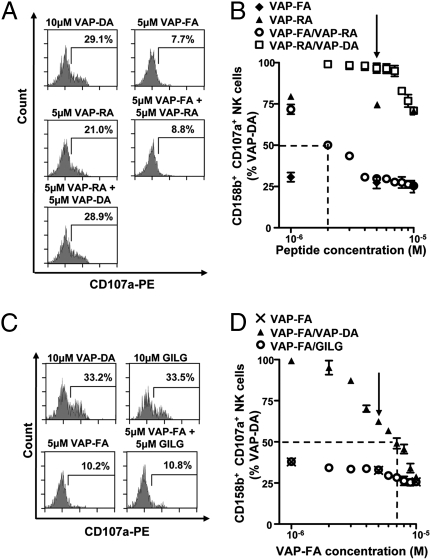
Intermediate KIR-binding or HLA-A2 binding peptides do not antagonize inhibition by a strong KIR-binding peptide. T2 cells were incubated with VAP-FA, VAP-RA, or VAP-DA alone or in combination and degranulation assays performed. Flow cytometry plots (A) and the results of peptide mix titrations (B) are shown. Peptide mixes were made to 10 μM final concentration. For the titration of VAP-FA and the VAP-FA:VAP-RA combination, the concentration of VAP-FA is plotted, and for VAP-RA and VAP-RA:VAP-DA, that of VAP-RA is plotted. The dashed line indicates the concentration of VAP-FA at which 50% of NK cells relative to VAP-DA alone are inhibited for the VAP-FA:VAP-RA mix. The arrow indicates the 50:50 peptide mix point. (C and D) T2 cells were incubated with VAP-FA or an HLA-A*0201-binding peptide (GILG). (C) Degranulation of CD3−CD56+CD158b+ NK cells in response to T2 cells alone or incubated with the indicated peptides. (D) The fraction of degranulating CD3−CD56+CD158b+ NK cells in response to T2 cells incubated with VAP-FA alone or in combination with GILG or VAP-DA to a final concentration of 10 μM. The dashed line indicates the concentration of VAP-FA at which 50% of NK cells relative to VAP-DA alone are inhibited for the VAP-FA:VAP-DA mix. The arrow indicates the 50:50 peptide mix point. For all experiments, data are normalized to the degranulation observed in response to T2 cells incubated with 10 μM VAP-DA, and the means ± SEM of three independent experiments are shown.
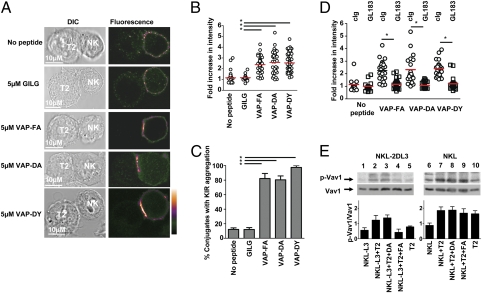
The weak KIR-binding peptide VAP-DA mediates KIR clustering at the interface between NK cells and target cells. (A) Clustering at the interface between NKL-2DL3 cells and T2 targets in the absence of peptide or in the presence of the indicated peptides. Images are labeled with a pseudocolor scale. (B) The increase in fluorescence intensity at the interface between NKL-2DL3 and the T2 cells compared with the NKL plasma membrane at a noncontact area (means are indicated in red). (C) The percentage of conjugates with KIR clustering depicted as the means and SDs from three independent experiments. A minimum of 17 conjugates were counted per condition per experiment. (D) The effect of addition of GL183 on clustering between peptide pulsed T2 cells and NKL-2DL3. In all panels, an asterisk indicates a significant difference of P < 0.0001 (Student t test). (E) Western blot analysis of KIR2DL3 transfected NKL (Left) or untransfected NKL (Right) cells incubated with T2 cells unloaded (lanes 2 and 7) or loaded overnight with the peptides VAP-DA (lanes 3 and 8) and VAP-FA (lanes 4 and 9) at 20 μM and then analyzed for the presence of absence of VAV1 and phosphorylated VAV1. Baseline signals from NKL-2DL3 (lane 1), NKL-2DL3 (lane 6), and T2 cells (lanes 5 and 10) are also shown. The mean quantitation of the ratio of pVAV1 to VAV1 from three independent experiments ± SEM is shown graphically.
Comment in
-
Antagonizing inhibition gets NK cells going.Proc Natl Acad Sci U S A. 2010 Jun 8;107(23):10333-4. doi: 10.1073/pnas.1005636107. Epub 2010 Jun 2. Proc Natl Acad Sci U S A. 2010. PMID: 20534579 Free PMC article. No abstract available.
References
-
- Malnati MS, et al. Peptide specificity in the recognition of MHC class I by natural killer cell clones. Science. 1995;267:1016–1018. - PubMed
-
- Maenaka K, et al. Killer cell immunoglobulin receptors and T cell receptors bind peptide-major histocompatibility complex class I with distinct thermodynamic and kinetic properties. J Biol Chem. 1999;274:28329–28334. - PubMed
-
- Thananchai H, et al. Cutting Edge: Allele-specific and peptide-dependent interactions between KIR3DL1 and HLA-A and HLA-B. J Immunol. 2007;178:33–37. - PubMed
Publication types
MeSH terms
Substances
Grants and funding
LinkOut - more resources
Full Text Sources
Other Literature Sources
Molecular Biology Databases
Research Materials
Miscellaneous
