. 2010 May 18;107(20):9418-23.
doi: 10.1073/pnas.0913384107. Epub 2010 May 3.

Fear and safety learning differentially affect synapse size and dendritic translation in the lateral amygdala

Affiliations

Fear and safety learning differentially affect synapse size and dendritic translation in the lateral amygdala

Linnaea E Ostroff et al. Proc Natl Acad Sci U S A. .

Abstract

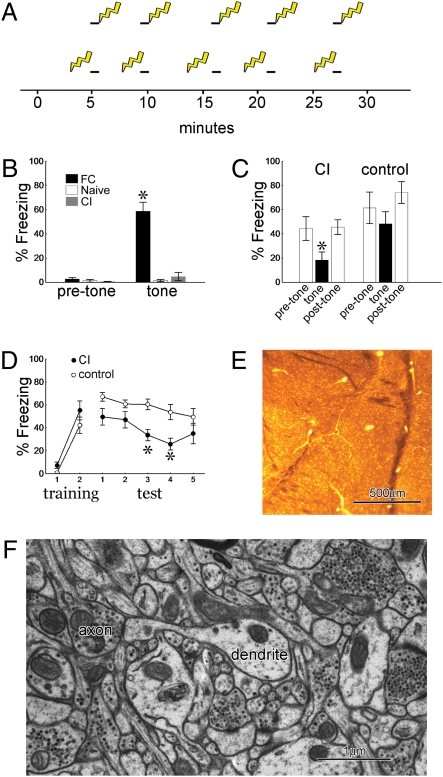
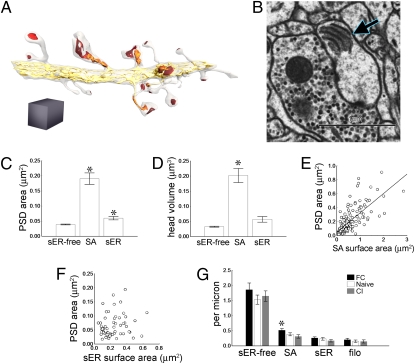
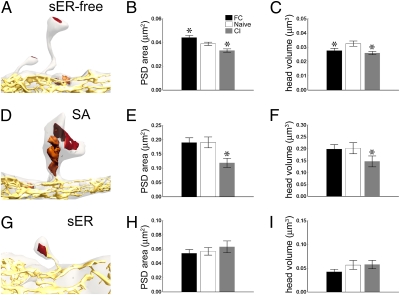
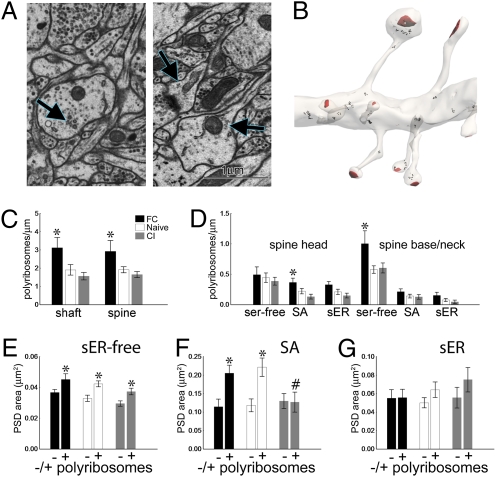
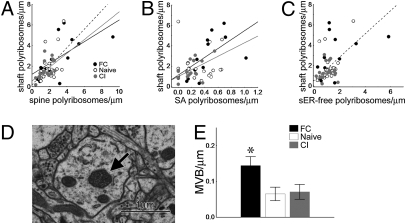
Fear learning is associated with changes in synapse strength in the lateral amygdala (LA). To examine changes in LA dendritic spine structure with learning, we used serial electron microscopy to re-construct dendrites after either fear or safety conditioning. The spine apparatus, a smooth endoplasmic reticulum (sER) specialization found in very large spines, appeared more frequently after fear conditioning. Fear conditioning was associated with larger synapses on spines that did not contain a spine apparatus, whereas safety conditioning resulted in smaller synapses on these spines. Synapses on spines with a spine apparatus were smaller after safety conditioning but unchanged with fear conditioning, suggesting a ceiling effect. There were more polyribosomes and multivesicular bodies throughout the dendrites from fear conditioned rats, indicating increases in both protein synthesis and degradation. Polyribosomes were associated with the spine apparatus under both training conditions. We conclude that LA synapse size changes bidirectionally with learning and that the spine apparatus has a central role in regulating synapse size and local translation.


Conflict of interest statement

The authors declare no conflict of interest.

Figures

Fig. 1.
Fig. 1.
Behavior and spine numbers. (A) Training protocols for fear conditioning (Upper) and conditioned inhibition (Lower) indicating the exact timing of tones (black bars) and footshocks (lightning bolts). (B) One day after training, the fear conditioning protocol produces freezing to the tone. (C) The tone suppresses fear of the context in conditioned inhibition (CI) trained but not control rats (n = 8 per group). (D) CI trained rats subsequently acquire less fear to the tone than do control rats (n = 8 per group). (E) Lateral amygdala (LA) section embedded in resin for section transmission electron microscopy showing approximate area of tissue collected for analysis (asterisk). (F) EM of LA neuropil showing a dendrite with a spine carrying a PSD apposed to an axon with docked vesicles. All graphs show means ± SEM (*P < 0.01).
Fig. 2.
Fig. 2.
Smooth endoplasmic reticulum (sER) and the spine apparatus. (A) Reconstructed dendrite showing postsynaptic densities (PSDs) (red), sER (yellow), and the spine apparatus (orange). Gray cube = 1 μm3. (B) EM of spine head containing a spine apparatus (arrow). (C) PSDs on SA spines (spines that contain a spine apparatus) are larger than both sER-free and sER spine PSDs, and sER spine PSDs are larger than sER-free spine PSDs (*P < 0.0005). (D) SA spines have greater head volume than sER-free or sER spines (*P < 0.0005). (E) SA surface area is correlated with PSD area (r2 = 0.55, P < 0.01). (F) PSD area is not correlated with sER area in spines where sER enters the spine head (r2 = 0.0077, P = 0.70). (G) Spine density is stable with training, except for an increase in SA spines with fear conditioning (FC) (*P < 0.05). Bar graphs show means ± SEM.
Fig. 3.
Fig. 3.
Effects of training on spine size. (A) Reconstruction of a smooth endoplasmic reticulum (sER)-free spine (colors as in Fig. 2A). (B) Postsynaptic density (PSD) area of sER-free spines changes bidirectionally with training. (C) Head volume of sER-free spines decreases with fear conditioning and conditioned inhibition (CI). (D) Reconstruction of an SA spine. (E) PSD area of SA spines decreases with CI. (F) Head volume of SA spines decreases with CI. (G) Reconstruction of an sER spine. (H and I) No change in PSD area (H) or head volume (I) of sER spines with training. All graphs show means ± SEM (*P < 0.05).
Fig. 4.
Fig. 4.
Polyribosomes in spines. (A) EM of polyribosomes (arrows) in the dendritic shaft (Left) and spine (Right). (B) Reconstruction of a dendrite with polyribosomes (black) and postsynaptic densities (PSDs) (red). (C) There are more polyribosomes in both the dendritic shaft and spines with fear conditioning (FC). (D) Polyribosome frequency increases with FC in SA spine heads and smooth endoplasmic reticulum (sER)-free spine bases and necks relative to the naïve group. (E) sER-free spines with polyribosomes (+) have smaller PSDs than sER-free spines without polyribosomes (−) in all three training groups. (F) SA spines with polyribosomes have larger PSDs than SA spines without polyribosomes in the FC and naïve groups only. SA spines with polyribosomes in the naïve group (+, white bar) have larger PSDs than SA spines with polyribosomes in the conditioned inhibition group (+, gray bar, #P < 0.002). (G) PSD area on sER spines is unaffected by polyribosomes. All graphs show means ± SEM (*P < 0.04).
Fig. 5.
Fig. 5.
Protein synthesis and degradation in the dendritic shaft. (A) Shaft polyribosomes correlate with spine polyribosomes in all groups [fear conditioning (FC) r = 0.64, P < 0.02; naïve r = 0.52, P < 0.02; conditioned inhibition (CI) r = 0.54, P < 0.02]. (B) In the FC and CI groups shaft polyribosomes correlate with SA spines with polyribosomes (forward stepwise multiple regression; FC R2 = 0.39, P < 0.02; CI R2 = 0.30, P < 0.02). (C) In the naïve group shaft polyribosomes correlate with smooth endoplasmic reticulum (sER)-free spines with polyribosomes (forward stepwise multiple regression; R2 = 0.21, P < 0.03). (D) EM of a multivesicular body (arrow) in a dendrite. (E) There are more multivesicular bodies in the FC group. Bar graph shows means ± SEM (*P < 0.007).

References

    1. Sah P, Westbrook RF, Lüthi A. Fear conditioning and long-term potentiation in the amygdala: What really is the connection? Ann N Y Acad Sci. 2008;1129:88–95. - PubMed
    1. LeDoux JE. Emotion circuits in the brain. Annu Rev Neurosci. 2000;23:155–184. - PubMed
    1. Rescorla RA. Conditioned inhibition of fear resulting from negative CS-US contingencies. J Comp Physiol Psychol. 1969;67:504–509. - PubMed
    1. Rogan MT, Stäubli UV, LeDoux JE. Fear conditioning induces associative long-term potentiation in the amygdala. Nature. 1997;390:604–607. - PubMed
    1. Rogan MT, Leon KS, Perez DL, Kandel ER. Distinct neural signatures for safety and danger in the amygdala and striatum of the mouse. Neuron. 2005;46:309–320. - PubMed

Publication types

LinkOut - more resources