. 2010 May 18;107(20):9323-8.
doi: 10.1073/pnas.0910712107. Epub 2010 May 3.

Identification of select glucocorticoids as Smoothened agonists: potential utility for regenerative medicine

Affiliations

Identification of select glucocorticoids as Smoothened agonists: potential utility for regenerative medicine

Jiangbo Wang et al. Proc Natl Acad Sci U S A. .

Abstract

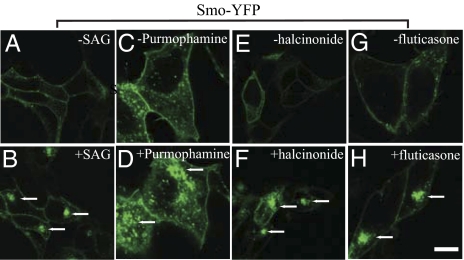
Regenerative medicine holds the promise of replacing damaged tissues largely by stem cell activation. Hedgehog signaling through the plasma membrane receptor Smoothened (Smo) is an important process for regulating stem cell proliferation. The development of Hedgehog-related therapies has been impeded by a lack of US Food and Drug Administration (FDA)-approved Smo agonists. Using a high-content screen with cells expressing Smo receptors and a beta-arrestin2-GFP reporter, we identified four FDA-approved drugs, halcinonide, fluticasone, clobetasol, and fluocinonide, as Smo agonists that activate Hedgehog signaling. These drugs demonstrated an ability to bind Smo, promote Smo internalization, activate Gli, and stimulate the proliferation of primary neuronal precursor cells alone and synergistically in the presence of Sonic Hedgehog protein. Halcinonide, fluticasone, clobetasol, and fluocinonide provide an unprecedented opportunity to develop unique clinical strategies to treat Hedgehog-dependent illnesses.


Conflict of interest statement

The authors declare no conflict of interest.

Figures

Fig. 1.
Fig. 1.
FGSA drugs halcinonide, fluticasone, clobetasol, and fluocinonide as well as cyclopamine, SAG, and purmorphamine regulate the intracellular distribution of βarr2-GFP in cells stably overexpressing Smo-633 and βarr2-GFP. (A) Structures of the glucocorticoid drugs, SAG and purmorphamine. Confocal images of βarr2-GFP expressed alone (B) or stably with Smo-633 in U2OS cells (C–J). Cells were treated with DMSO (C), 100 nM cyclopamine (D), 100 nM cyclopamine and 5 μM SAG (E), 100 nM cyclopamine and 5 μM purmorphamine (F), 100 nM cyclopamine and 5 μM halcinonide (G), 100 nM cyclopamine and 5 μM fluticasone (H), 100 nM cyclopamine and 5 μM clobetasol (I), and 100 nM cyclopamine and 5 μM fluocinonide (J) for 2 h at 37 °C. Representative images of three independent experiments are shown. (Scale bar: 10 μm.) Cyc, cyclopamine; Pur, purmorphamine. (K) Concentration response profile of Smo/βarr2-GFP aggregate formation. U2OS cells stably expressing Smo-633 and βarr2-GFP were pretreated with 100 nM cyclopamine overnight in 384-well screening plates. The cells were then treated with compounds over a range of concentrations from 0–10 μM for 2 h. Tiff images of cell responses acquired on an ImageXpress Ultra were analyzed by the platform-accompanying software Transfluor HT (Molecular Devices) to quantify the aggregates produced by the compounds. The data were analyzed by nonlinear regression and fit to a sigmoid dose–response using GraphPad Prism (GraphPad Software, Inc.). Data were acquired in triplicate from three independent experiments and are presented as the mean ± SEM.
Fig. 2.
Fig. 2.
Smo agonists induce Smo-YFP internalization. Effects of SAG, purmorphamine, halcinonide, and fluticasone on Smo-YFP internalization are shown. Confocal images of Smo-YFP expressing HEK293 cells left untreated (A, C, E, and G) and treated with 2 μM SAG (B), 5 μM purmorphamine (D), 2 μM halcinonide (F), and 2 μM fluticasone (H) for 30–40 min at 37 °C. Arrows indicate internalized Smo-YFP. Representative images from three independent experiments are shown. (Scale bar: 10 μm.)
Fig. 3.
Fig. 3.
Smo agonist competitively replaces bodipy-cyclopamine binding to Smo. Competitive binding of bodipy-cyclopamine with Smo agonists was performed in HEK293 cells, as described in Materials and Methods. Data were normalized to the maximal binding of bodipy-cyclopamine over baseline. Competition curves for each compound were initially analyzed by linear regression, and those compounds that generated a line with a slope not significantly different from zero (cortisone, P = 0.59; purmorphamine, P = 0.12; n = 3; α = 0.05) were considered not able to compete with bodipy-cyclopamine for Smo binding. The displacement data of the remaining compounds were analyzed by fitting to a one-site competition curve using GraphPad Prism (GraphPad Software, Inc.). Data were acquired in triplicate from three independent experiments and are presented as the mean ± SEM.
Fig. 4.
Fig. 4.
Gli-luciferase response in Shh-LIGHT2 cells treated with Smo ligands. (A) Gli-luciferase reporter activity in Shh-LIGHT2 cells in response to Smo agonists. Shh-LIGHT2 cells cultured to confluence were individually treated for 30 h with the following compounds: halcinonide, fluticasone, clobetasol, fluocinonide, the positive controls purmorphamine and SAG, and the negative control cortisone. Results are presented as the mean ± SEM from multiple individual experiments (n > 3) performed in triplicate. (B) Effects of Shh-conditioned media (Shh) on Smo agonists. Shh-LIGHT2 cells were cultured to confluence and treated for 30 h with DMSO, 2% Shh, 5 μM of the indicated compounds, or 5 μM of the indicated compounds in the presence of 2% Shh. Results are presented as the mean ± SEM from multiple individual experiments (n ≥ 3) performed in triplicate. The statistical significance was analyzed by a two-tailed Student's t test, with *P < 0.05 (α = 0.05) defined as significant.
Fig. 5.
Fig. 5.
Effects of FGSAs and Shh on primary neuronal GCP proliferation. (A) Primary neuronal GCP proliferation data of Smo agonists. Expanded version (Right) of the boxed region (Left). Cells were treated with compounds for 48 h and then pulsed with [3H]thymidine ([3H]Td) and cultured for 16 h before being measured for [3H]Td incorporation. Cubic splines were fit to the data points using GraphPad Prism (GraphPad Software, Inc.) to highlight the responses. Data were acquired in triplicate from three independent experiments and are presented as the mean ± SEM. (B) Shh modulation of primary neuronal GCP proliferation in response to Smo agonists. The cells were treated with DMSO or 2% Shh alone or in the absence or presence of 2% Shh with one of the following compounds: 5 μM halcinonide, fluticasone clobetasol, or fluocinonide; 5 μM dexamethasone; and the positive control SAG (0.008 μM) or purmorphamine (0.073 μM). The [3H]Td incorporation data are presented as fold change vs. DMSO treatment, which was defined as 1. Triplicate data are presented as the mean ± SEM (n = 3). The statistical significance was analyzed by a two-tailed Student's t test, with *P < 0.05 (α = 0.05) defined as significant (compound + Shh over Shh). (C) Halcinonide and dexamethasone have opposite effects on primary neuronal GCP proliferation. Cells were treated with DMSO, 2% Shh, 20% Shh, or halcinonide in the presence or absence of 2% Shh (Left) and with dexamethasone in the presence or absence of 2% Shh (Right; the minor change in responsiveness between experiments to 2% Shh treatment, reflected as a decrease in GCP proliferation, may result from batch-to-batch variability in Shh). Dashed lines indicate the cell responses to DMSO vehicle, 2% Shh, and 20% Shh. Data acquired in triplicate are presented as the mean ± SEM (n = 3).
Fig. 6.
Fig. 6.
Halcinonide, fluticasone, clobetasol, fluocinonide, and other glucocorticoids regulate cyclin D2 expression and caspase-3 degradation in primary neuronal GCPs. Primary neuronal GCPs derived from 4-day-old mice were individually treated for 64 h with DMSO, 2% Shh, 0.625 μM purmorphamine, 0.5 μM SAG, 2.5 μM fluticasone, and the remaining compounds at 25 μM. Cells were harvested in SDS sample buffer, protein samples were resolved on SDS/PAGE gels, and the corresponding immunoblots were probed by antibodies against cyclin D2, cleaved caspase-3, and actin (n = 3). A representative immunoblot is shown.

References

    1. Ingham PW, McMahon AP. Hedgehog signaling in animal development: Paradigms and principles. Genes Dev. 2001;15:3059–3087. - PubMed
    1. Lai K, Kaspar BK, Gage FH, Schaffer DV. Sonic hedgehog regulates adult neural progenitor proliferation in vitro and in vivo. Nat Neurosci. 2003;6:21–27. - PubMed
    1. Dahmane N, Ruiz i Altaba A. Sonic hedgehog regulates the growth and patterning of the cerebellum. Development. 1999;126:3089–3100. - PubMed
    1. Machold R, et al. Sonic hedgehog is required for progenitor cell maintenance in telencephalic stem cell niches. Neuron. 2003;39:937–950. - PubMed
    1. Palma V, et al. Sonic hedgehog controls stem cell behavior in the postnatal and adult brain. Development. 2005;132:335–344. - PMC - PubMed

Publication types

MeSH terms