Comparative Study
. 2010 May 18;107(20):9186-91.
doi: 10.1073/pnas.0914771107. Epub 2010 May 3.

Comparing genomes to computer operating systems in terms of the topology and evolution of their regulatory control networks

Affiliations
Comparative Study

Comparing genomes to computer operating systems in terms of the topology and evolution of their regulatory control networks

Koon-Kiu Yan et al. Proc Natl Acad Sci U S A. .

Abstract

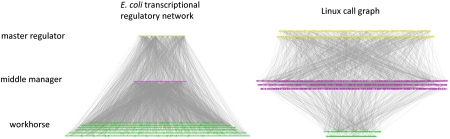
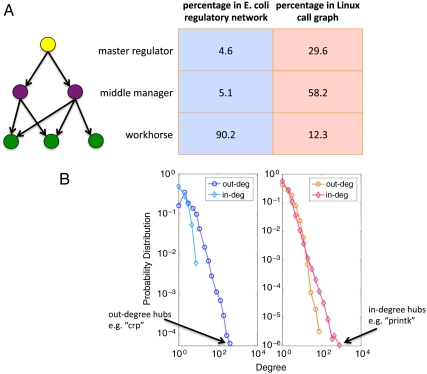
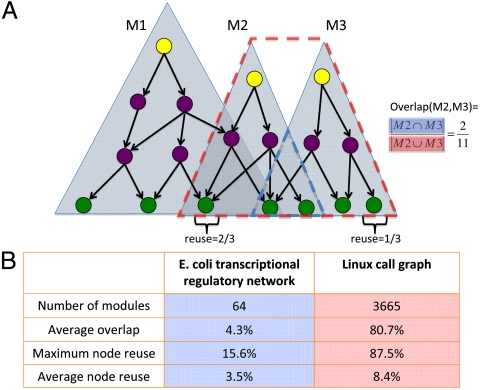
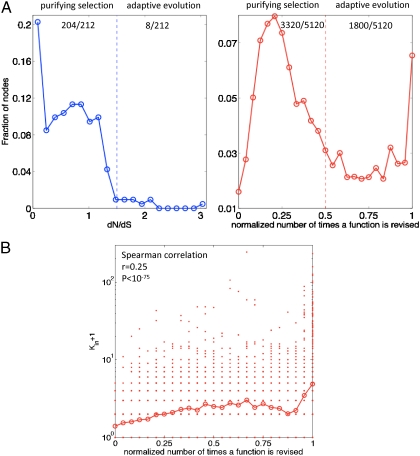
The genome has often been called the operating system (OS) for a living organism. A computer OS is described by a regulatory control network termed the call graph, which is analogous to the transcriptional regulatory network in a cell. To apply our firsthand knowledge of the architecture of software systems to understand cellular design principles, we present a comparison between the transcriptional regulatory network of a well-studied bacterium (Escherichia coli) and the call graph of a canonical OS (Linux) in terms of topology and evolution. We show that both networks have a fundamentally hierarchical layout, but there is a key difference: The transcriptional regulatory network possesses a few global regulators at the top and many targets at the bottom; conversely, the call graph has many regulators controlling a small set of generic functions. This top-heavy organization leads to highly overlapping functional modules in the call graph, in contrast to the relatively independent modules in the regulatory network. We further develop a way to measure evolutionary rates comparably between the two networks and explain this difference in terms of network evolution. The process of biological evolution via random mutation and subsequent selection tightly constrains the evolution of regulatory network hubs. The call graph, however, exhibits rapid evolution of its highly connected generic components, made possible by designers' continual fine-tuning. These findings stem from the design principles of the two systems: robustness for biological systems and cost effectiveness (reuse) for software systems.


Conflict of interest statement

The authors declare no conflict of interest.

Figures

Fig. 1.
Fig. 1.
The hierarchical layout of the E. coli transcriptional regulatory network and the Linux call graph. (Left) The transcriptional regulatory network of E. coli. (Right) The call graph of the Linux Kernel. Nodes are classified into three categories on the basis of their location in the hierarchy: master regulators (nodes with zero in-degree, Yellow), workhorses (nodes with zero out-degree, Green), and middle managers (nodes with nonzero in- and out-degree, Purple). Persistent genes and persistent functions (as defined in the main text) are shown in a larger size. The majority of persistent genes are located at the workhorse level, but persistent functions are underrepresented in the workhorse level. For easy visualization of the Linux call graph, we sampled 10% of the nodes for display. Under the sampling, the relative portion of nodes in the three levels and the ratio between persistent and nonpersistent nodes are preserved compared to the original network. The entire E. coli transcriptional regulatory network is displayed.
Fig. 2.
Fig. 2.
Comparison of the E. coli transcriptional regulatory network and Linux call graph in terms of topology and hierarchical structure. (A) The distribution of the three categories in the E. coli transcriptional regulatory network and the Linux call graph. The transcriptional regulatory network (1,378 nodes) follows a conventional hierarchical picture, with a few top regulators and many workhorse proteins. The Linux call graph (12,391 nodes), on the other hand, possesses many regulators; the number of workhorse routines is much lower in proportion. (B) Degree distributions of the E. coli transcriptional regulatory network and the Linux call graph. The regulatory network has a broad out-degree distribution but a narrow in-degree distribution. The situation is reversed in the call graph, where we can find in-degree hubs, but the out-degree distribution is rather narrow. An out-degree hub in the E. coli regulatory network and an in-degree hub in the Linux call graph are shown.
Fig. 3.
Fig. 3.
Modules in the E. coli transcriptional regulatory network and Linux call graph. (A) Definition of modules, reuse, and overlap. A module is characterized by a master regulator, with zero in-degree, and all of the nodes regulated directly or indirectly by the master regulator. Here there are three modules (M1, M2, and M3) represented by three triangles. Reuse of a node is defined as the fraction of modules to which the node belongs. This quantity is illustrated with the two labeled nodes. One is shared by M1 and M2 but not M3, and thus the reuse is 2/3. The other belongs to only M3; its reuse is therefore 1/3. The overlap between a pair of modules is defined by the size of their intersection normalized by their union. The overlap of M2 and M3 is thus 2/11. (B) Statistics of modules in the E. coli transcriptional regulatory network and the Linux call graph. The average overlap is given by the mean overlap between pairs of randomly chosen modules. Nodes in the call graph are in general more generic; i.e., they are reused by more modules.
Fig. 4.
Fig. 4.
The rate of evolution of persistent genes and persistent functions. (A) Distribution of the rate of evolution. In the case of the E. coli transcriptional regulatory network (Left), the rate of evolution is quantified by dN/dS, the ratio of nonsynonymous to synonymous substitution rate. On the basis of the rate of evolution, we divide the histogram into two parts representing genes evolving in a more conservative (Left) or a more adaptive (Right) way, respectively. The overall trend of the distribution is decreasing: 204 out of 212 persistent genes are evolving under purifying selection, and only 8 out of 212 undergo some degree of adaptive evolution. The fraction of genes under positive selection, by definition dN/dS > 1, is 51 out of 212. In the case of the Linux call graph (Right), we quantify the rate of evolution by the number of revisions to the function in the source code. That number is then normalized by the total number of releases we studied—i.e., 24 (refer to Materials and Methods). The distribution is bimodal: 3,320 out of 5,120 persistent functions are revised infrequently (left portion), but there are 1,800 persistent functions that are adaptive (right portion) and 335 of them got updated in every version. (B) Correlation between the in-degree (Kin + 1) and the rate of evolution in persistent functions. In the Linux call graph, the rate of revision of persistent functions is positively correlated with their in-degrees (Spearman correlation r = 0.25). Highly used functions are revised more often. (Note that more than one persistent function may coincide at a single dot shown in the scatter plot. Each open circle represents the geometric mean in the corresponding bin.)

References

    1. Alon U. An Introduction to Systems Biology. London: Chapman & Hall/CRC; 2007.
    1. Barabási A. LINKED: The New Science of Networks. Cambridge, MA: Perseus; 2002.
    1. Yu H, Gerstein M. Genomic analysis of the hierarchical structure of regulatory networks. Proc Natl Acad Sci USA. 2006;103:14724–14731. - PMC - PubMed
    1. Bhardwaj N, Yan KK, Gerstein M. Analysis of diverse regulatory networks in a hierarchical context shows consistent tendencies for collaboration in the middle levels. Proc Natl Acad Sci USA. 2010;107:6841–6846. - PMC - PubMed
    1. Lehman MM. Programs, life cycles, and laws of software evolution. Proc IEEE. 1980;68:1060–1076.

Publication types

LinkOut - more resources