. 2010 Jul;185(3):1033-44.
doi: 10.1534/genetics.110.116863. Epub 2010 May 3.

Genome-wide association studies and the problem of relatedness among advanced intercross lines and other highly recombinant populations

Affiliations

Genome-wide association studies and the problem of relatedness among advanced intercross lines and other highly recombinant populations

Riyan Cheng et al. Genetics. 2010 Jul.

Abstract

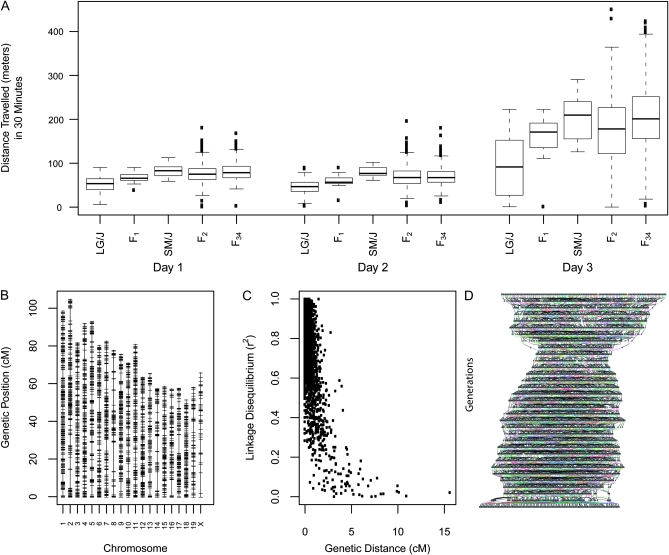
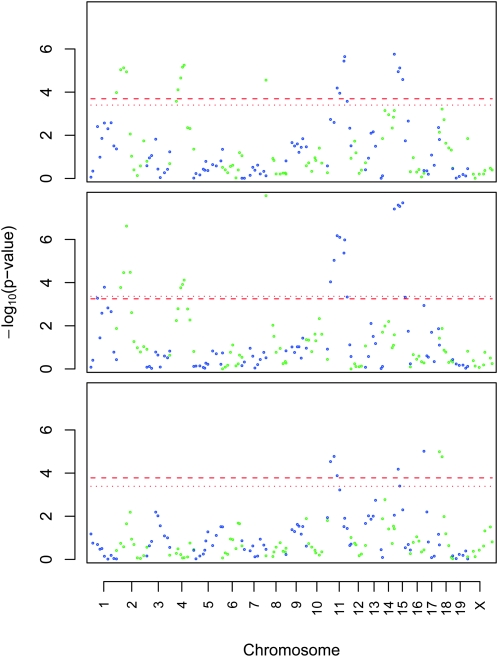
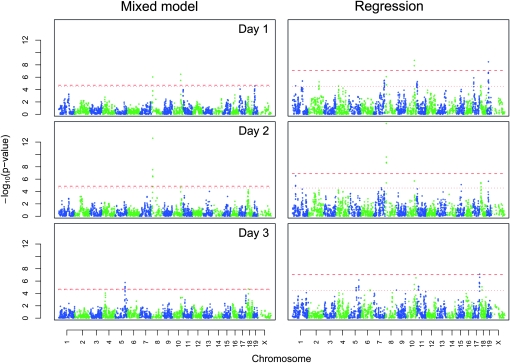
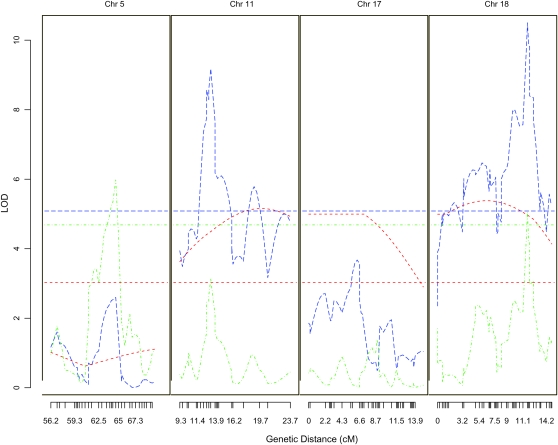
Model organisms offer many advantages for the genetic analysis of complex traits. However, identification of specific genes is often hampered by a lack of recombination between the genomes of inbred progenitors. Recently, genome-wide association studies (GWAS) in humans have offered gene-level mapping resolution that is possible because of the large number of accumulated recombinations among unrelated human subjects. To obtain analogous improvements in mapping resolution in mice, we used a 34th generation advanced intercross line (AIL) derived from two inbred strains (SM/J and LG/J). We used simulations to show that familial relationships among subjects must be accounted for when analyzing these data; we then used a mixed model that included polygenic effects to address this problem in our own analysis. Using a combination of F(2) and AIL mice derived from the same inbred progenitors, we identified genome-wide significant, subcentimorgan loci that were associated with methamphetamine sensitivity, (e.g., chromosome 18; LOD = 10.5) and non-drug-induced locomotor activity (e.g., chromosome 8; LOD = 18.9). The 2-LOD support interval for the former locus contains no known genes while the latter contains only one gene (Csmd1). This approach is broadly applicable in terms of phenotypes and model organisms and allows GWAS to be performed in multigenerational crosses between and among inbred strains where familial relatedness is often unavoidable.


Figures

F<sc>igure</sc> 1.—
Figure 1.—
Key parameters for SM/J, LG/J, and recombinant mice. (A) Box and whisker plots of locomotor behavior on days 1 and 2 when vehicle was administered and on day 3 when methamphetamine was administered. (B) The genetic map estimated from recombinations between generation 33 and generation 34 of the AIL. (C) Linkage disequilibrium (LD) between makers (r2) on the same chromosome vs. genetic distance (cM). (D) The pedigree of the AIL population from the F2 to the F34 generation. Generations are arranged vertically, each very small box is an individual, and colored lines indicate relationships across generations.
F<sc>igure</sc> 2.—
Figure 2.—
QTL identified using the F2 mice: QTL for locomotor activity following saline administration on days 1 (top) and 2 (middle) or following methamphetamine administration on day 3 (bottom). Alternating colors denote odd- or even-numbered chromosomes. The horizontal lines indicate genome-wide significance of P < 0.05 based on either permutation (dotted lines) or gene dropping (dashed lines).
F<sc>igure</sc> 3.—
Figure 3.—
QTL identified using AIL mice. QTL are for locomotor activity following saline administration on days 1 (top) and 2 (middle) or following methamphetamine administration on day 3 (bottom). The left three panels show the results for a mixed model in which relatedness was accounted for while the right panels show the results for a regression model that did not account for relatedness. Alternating colors denote odd- or even-numbered chromosomes. The horizontal lines indicate genome-wide significance of P < 0.05 based on either permutation (dotted lines) or gene dropping (dashed lines).
F<sc>igure</sc> 4.—
Figure 4.—
Plots showing detailed views of Haley–Knott's interval mapping for methamphetamine response on day 3 using F2 (red), AIL (green), and integrated analysis (blue) in specific regions of the indicated chromosomes. Tick marks along the x-axis indicate the location of physical markers that were successfully genotyped. These data are identical to those shown in more detail in Figure S2, Figure S3, and Figure S4.

Similar articles

Cited by

References

    1. Abney, M., 2009. A graphical algorithm for fast computation of identity coefficients and generalized kinship coefficients. Bioinformatics 25 1561–1563. - PMC - PubMed
    1. Abney, M., M. S. McPeek and C. Ober, 2000. Estimation of variance components of quantitative traits in inbred populations. Am. J. Hum. Genet. 66 629–650. - PMC - PubMed
    1. Aulchenko, Y. S., D. J. de Koning and C. Haley, 2007. Genomewide rapid association using mixed model and regression: a fast and simple method for genomewide pedigree-based quantitative trait loci association analysis. Genetics 177 577–585. - PMC - PubMed
    1. Bäckdahl, L., J. P. Guo, M. Jagodic, K. Becanovic, B. Ding et al., 2009. Definition of arthritis candidate risk genes by combining rat linkage-mapping results with human case control association data. Ann. Rheum. Dis. 68 1925–1932. - PubMed
    1. Balint-Kurti, P. J., J. C. Zwonitzer, R. J. Wisser, M. L. Carson, M. A. Oropeza-Rosas et al., 2007. Precise mapping of quantitative trait loci for resistance to southern leaf blight, caused by cochliobolus heterostrophus race O, and flowering time using advanced intercross maize lines. Genetics 176 645–657. - PMC - PubMed

Publication types