. 2010 Jun;185(2):431-41.
doi: 10.1534/genetics.110.116616. Epub 2010 May 3.

Whole-genome profiling of mutagenesis in Caenorhabditis elegans

Affiliations

Whole-genome profiling of mutagenesis in Caenorhabditis elegans

Stephane Flibotte et al. Genetics. 2010 Jun.

Abstract

Deep sequencing offers an unprecedented view of an organism's genome. We describe the spectrum of mutations induced by three commonly used mutagens: ethyl methanesulfonate (EMS), N-ethyl-N-nitrosourea (ENU), and ultraviolet trimethylpsoralen (UV/TMP) in the nematode Caenorhabditis elegans. Our analysis confirms the strong GC to AT transition bias of EMS. We found that ENU mainly produces A to T and T to A transversions, but also all possible transitions. We found no bias for any specific transition or transversion in the spectrum of UV/TMP-induced mutations. In 10 mutagenized strains we identified 2723 variants, of which 508 are expected to alter or disrupt gene function, including 21 nonsense mutations and 10 mutations predicted to affect mRNA splicing. This translates to an average of 50 informative mutations per strain. We also present evidence of genetic drift among laboratory wild-type strains derived from the Bristol N2 strain. We make several suggestions for best practice using massively parallel short read sequencing to ensure mutation detection.


Figures

F<sc>igure</sc> 1.—
Figure 1.—
Average genome coverage for the various strains studied in this work. The average coverage is calculated by dividing the sum of the aligned bases by the genome size. The boxes are color coded according to the mutagens used to create the strains and the color key is provided in the inset.
F<sc>igure</sc> 2.—
Figure 2.—
Number of variants called in two N2 wild-type strains (VC2010, Vancouver; WU N2, St. Louis) when the sequence of each is compared to the Cambridge wild-type reference genome WS190 and to each other. The blue bars correspond to variants common to VC2010 and WU N2 but different from the reference genome. The yellow plus red bars represent variants unique to either VC2010 or WU N2. The red bars are associated with nonsynonymous variants. The yellow bars are associated with synonymous variants.
F<sc>igure</sc> 3.—
Figure 3.—
Percentage of bases covered at a depth of at least 3× for each strain. The red bars correspond to the coverage for all the bases in the genome and the yellow bars to the bases within exons. The blue bars represent the percentage of exons for which all the bases are covered to a depth of at least 3×.
F<sc>igure</sc> 4.—
Figure 4.—
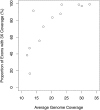
Percentage of exons totally covered to a depth of at least 3× as a function of average genome-wide coverage. Each data point corresponds to a different strain studied in this work.
F<sc>igure</sc> 5.—
Figure 5.—
Number of variants identified in the wild-type N2 strain VC2010 and the 10 mutated strains studied in this work. The boxes are color coded according to the mutagens used to create the stains and the color key is provided at the top left. The hatched bars correspond to the variants present in >1 of those 11 strains while the solid bars correspond to the unique variants.
F<sc>igure</sc> 6.—
Figure 6.—
Relative frequency of the various transitions and transversions identified in the 10 mutated strains studied in this work. The data for individual strains were combined according to the mutagen used. Only the variants appearing in a single strain were used. The color key identifying the type of mutation is provided in the inset, and the first letter represents the reference nucleotide while the second letter represents the mutated nucleotide.
F<sc>igure</sc> 7.—
Figure 7.—
Relative variant frequency affecting various gene features in the 10 mutated strains studied in this work. The data for individual strains were combined according to the mutagen used. Only the variants appearing in a single strain are represented. The proportions of nonsynonymous variants are represented in blue (dark for nonsense and light for missense mutations), the synonymous variants within exons are shown in green, the variants appearing in introns are yellow, and red bars are used for the remaining variants.
F<sc>igure</sc> 8.—
Figure 8.—
Deletion found on chromosome IV of the strain VC2366. The top panel shows the coverage in the region of interest. The middle panel shows the apparent distance between the alignments of read pairs to the reference genome. The bottom panel shows the fluorescence ratio in log2 scale in a comparative genomic hybridization experiment (Maydan et al. 2007).

Similar articles

Cited by

References

    1. Acevedo-Arozena, A., S. Wells, P. Potter, M. Kelly, R. D. Cox et al., 2008. ENU mutagenesis, a way forward to understand gene function. Annu. Rev. Genomics Hum. Genet. 9 49–69. - PubMed
    1. Anderson, K. V., 2000. Finding the genes that direct mammalian development: ENU mutagenesis in the mouse. Trends Genet. 16 99–102. - PubMed
    1. Anderson, P., 1995. Mutagenesis. Methods Cell Biol. 48 31–58. - PubMed
    1. Barstead, R. J., and D. G. Moerman, 2006. C. elegans deletion mutant screening. Methods Mol. Biol. 351 51–58. - PubMed
    1. Bautz, E., and E. Freese, 1960. On the mutagenic effects of alkylating agents. Proc. Natl. Acad. Sci. USA. 46 1585–1594. - PMC - PubMed

Publication types