

Expression quantitative trait loci: replication, tissue- and sex-specificity in mice
- PMID: 20439777
- PMCID: PMC2907192
- DOI: 10.1534/genetics.110.116087
Expression quantitative trait loci: replication, tissue- and sex-specificity in mice
Abstract
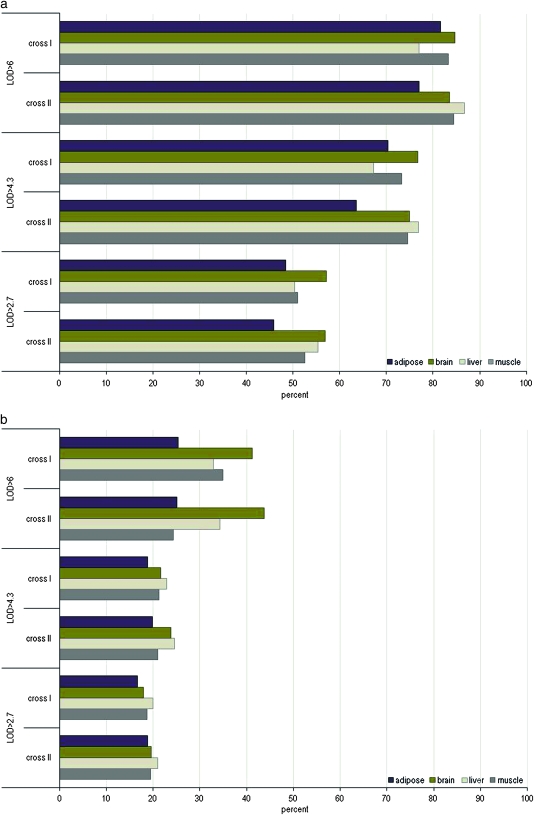
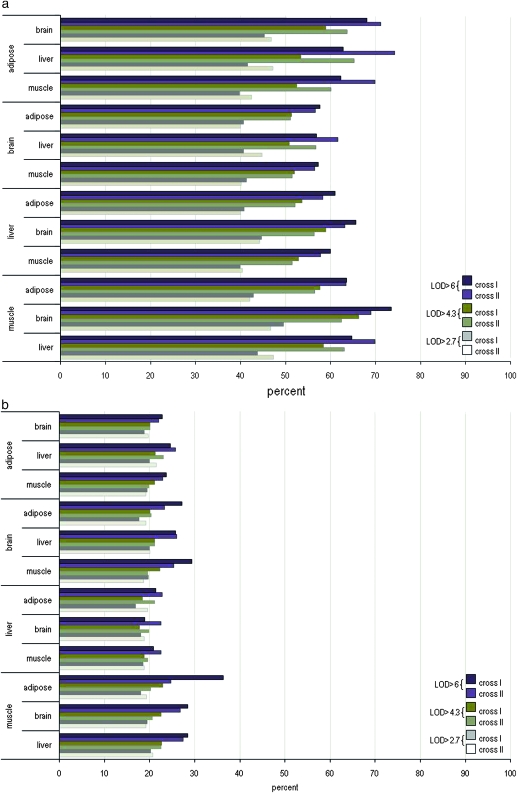
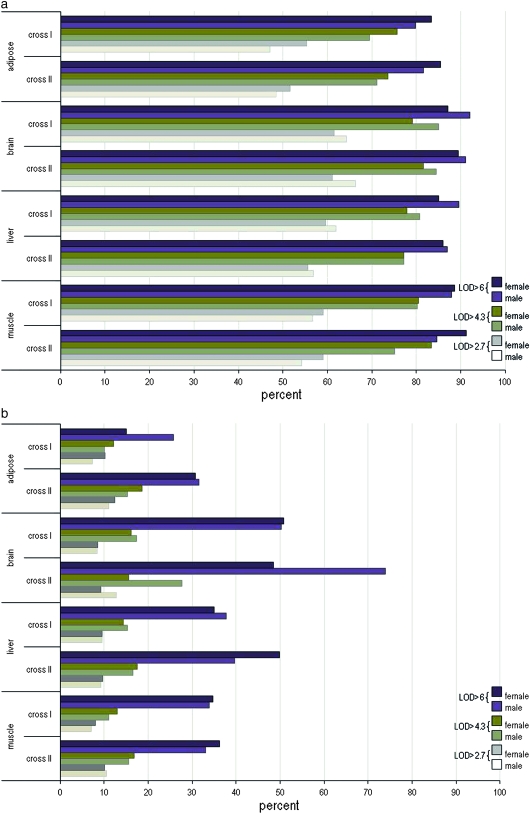
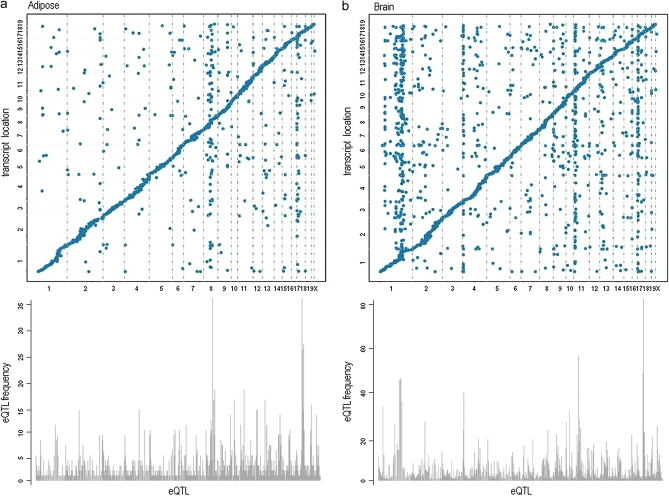
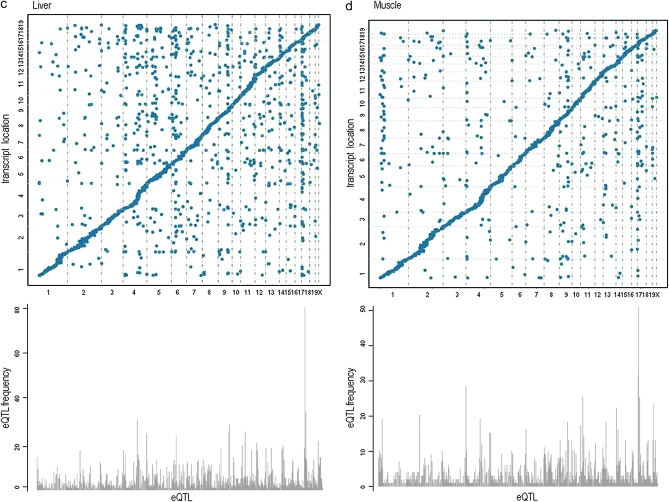
By treating the transcript abundance as a quantitative trait, gene expression can be mapped to local or distant genomic regions relative to the gene encoding the transcript. Local expression quantitative trait loci (eQTL) generally act in cis (that is, control the expression of only the contiguous structural gene), whereas distal eQTL act in trans. Distal eQTL are more difficult to identify with certainty due to the fact that significant thresholds are very high since all regions of the genome must be tested, and confounding factors such as batch effects can produce false positives. Here, we compare findings from two large genetic crosses between mouse strains C3H/HeJ and C57BL/6J to evaluate the reliability of distal eQTL detection, including "hotspots" influencing the expression of multiple genes in trans. We found that >63% of local eQTL and >18% of distal eQTL were replicable at a threshold of LOD > 4.3 between crosses and 76% of local and >24% of distal eQTL at a threshold of LOD > 6. Additionally, at LOD > 4.3 four tissues studied (adipose, brain, liver, and muscle) exhibited >50% preservation of local eQTL and >17% preservation of distal eQTL. We observed replicated distal eQTL hotspots between the crosses on chromosomes 9 and 17. Finally, >69% of local eQTL and >10% of distal eQTL were preserved in most tissues between sexes. We conclude that most local eQTL are highly replicable between mouse crosses, tissues, and sex as compared to distal eQTL, which exhibited modest replicability.
Figures
Similar articles
-
Allele-specific expression and eQTL analysis in mouse adipose tissue.BMC Genomics. 2014 Jun 13;15(1):471. doi: 10.1186/1471-2164-15-471. BMC Genomics. 2014. PMID: 24927774 Free PMC article.
-
Replication and narrowing of gene expression quantitative trait loci using inbred mice.Mamm Genome. 2009 Jul;20(7):437-46. doi: 10.1007/s00335-009-9199-0. Epub 2009 Jul 17. Mamm Genome. 2009. PMID: 19609828 Free PMC article.
-
Cis-acting expression quantitative trait loci in mice.Genome Res. 2005 May;15(5):681-91. doi: 10.1101/gr.3216905. Epub 2005 Apr 18. Genome Res. 2005. PMID: 15837804 Free PMC article.
-
eQTL analysis in mice and rats.Methods Mol Biol. 2009;573:285-309. doi: 10.1007/978-1-60761-247-6_16. Methods Mol Biol. 2009. PMID: 19763934 Review.
-
Attack behaviors in mice: from factorial structure to quantitative trait loci mapping.Eur J Pharmacol. 2005 Dec 5;526(1-3):172-85. doi: 10.1016/j.ejphar.2005.09.026. Epub 2005 Nov 2. Eur J Pharmacol. 2005. PMID: 16266699 Review.
Cited by
-
Genome-wide association mapping of blood cell traits in mice.Mamm Genome. 2013 Apr;24(3-4):105-18. doi: 10.1007/s00335-013-9448-0. Epub 2013 Feb 17. Mamm Genome. 2013. PMID: 23417284 Free PMC article.
-
The Hybrid Mouse Diversity Panel: a resource for systems genetics analyses of metabolic and cardiovascular traits.J Lipid Res. 2016 Jun;57(6):925-42. doi: 10.1194/jlr.R066944. Epub 2016 Apr 19. J Lipid Res. 2016. PMID: 27099397 Free PMC article. Review.
-
From expression QTLs to personalized transcriptomics.Nat Rev Genet. 2011 Apr;12(4):277-82. doi: 10.1038/nrg2969. Epub 2011 Mar 9. Nat Rev Genet. 2011. PMID: 21386863 Review.
-
Identification of a Functional Non-coding Variant in the GABA A Receptor α2 Subunit of the C57BL/6J Mouse Reference Genome: Major Implications for Neuroscience Research.Front Genet. 2019 Mar 29;10:188. doi: 10.3389/fgene.2019.00188. eCollection 2019. Front Genet. 2019. PMID: 30984232 Free PMC article.
-
Novel insights into the regulatory architecture of CD4+ T cells in rheumatoid arthritis.PLoS One. 2014 Jun 24;9(6):e100690. doi: 10.1371/journal.pone.0100690. eCollection 2014. PLoS One. 2014. PMID: 24959711 Free PMC article.
References
-
- Bystrykh, L., E. Weersing et al., 2005. Uncovering regulatory pathways that affect hematopoietic stem cell function using ‘genetical genomics’. Nat. Genet. 37(3): 225–232. - PubMed
-
- Davenport, E. L., G. J. Morgan and F. E. Davies, 2008. Untangling the unfolded protein response. Cell Cycle 7(7): 865–869. - PubMed
Publication types
MeSH terms
Grants and funding
LinkOut - more resources
Full Text Sources
Molecular Biology Databases
