. 2010 Jun;185(2):405-16.
doi: 10.1534/genetics.110.114983. Epub 2010 May 3.

Statistical design and analysis of RNA sequencing data

Affiliations

Statistical design and analysis of RNA sequencing data

Paul L Auer et al. Genetics. 2010 Jun.

Abstract

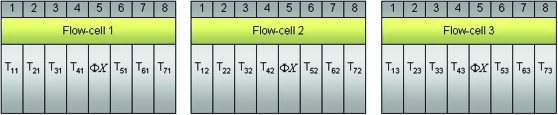
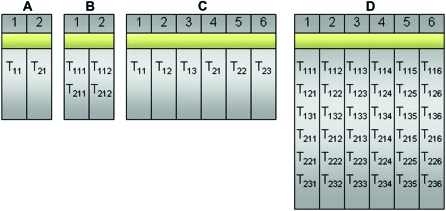
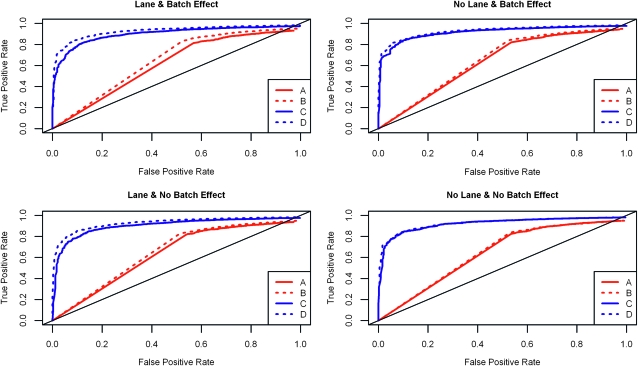
Next-generation sequencing technologies are quickly becoming the preferred approach for characterizing and quantifying entire genomes. Even though data produced from these technologies are proving to be the most informative of any thus far, very little attention has been paid to fundamental design aspects of data collection and analysis, namely sampling, randomization, replication, and blocking. We discuss these concepts in an RNA sequencing framework. Using simulations we demonstrate the benefits of collecting replicated RNA sequencing data according to well known statistical designs that partition the sources of biological and technical variation. Examples of these designs and their corresponding models are presented with the goal of testing differential expression.


Figures

F<sc>igure</sc> 1.—
Figure 1.—
Hypothetical Illumina GA flow cell with mRNA isolated from subjects within seven different treatment groups formula image and loaded into individual lanes (e.g., the mRNA from the subject within treatment group 1 is sequenced in lane 1). As a control, a formula image genomic sample is often loaded into lane 5. The bacteriophage formula image genome is known exactly and can be used to recalibrate the quality scoring of sequencing reads from other lanes (Bentley et al. 2008).
F<sc>igure</sc> 2.—
Figure 2.—
The log2 fold change, between Treatment1 and Treatment2, of the normalized gene expression is plotted on the y-axis, and the mean log2 expression is plotted on the x-axis. Gene expression counts were normalized by the column totals of the corresponding 2 × 2 table (e.g., Table 1). Blue dots represent significantly differentially expressed genes as established by Fisher's exact test; gray dots represent genes with similar expression. The red horizontal line at zero provides a visual check for symmetry.
F<sc>igure</sc> 3.—
Figure 3.—
A multiple flow-cell design based on three biological replicates within seven treatment groups. There are three flow cells with eight lanes per flow cell. The control formula image sample is in lane 5 of each flow cell. Tij refers to the formula image replicate in the formula image treatment group formula image.
F<sc>igure</sc> 4.—
Figure 4.—
Comparison of two designs for testing differential expression between treatments A and B. Treatment A is denoted by red tones and treatment B by blue tones. In the ideal balanced block design (left), six samples formula image are bar coded, pooled, and processed together. The pool is then divided into six equal portions that are input to six lanes formula image of the flow cell. Bar coding in the balanced block design results in six technical replicates formula image of each sample, while balancing batch and lane effects and blocking on lane. The balanced block design also allows partitioning of batch and lane effects from the within-group biological variability. The confounded design (right) represents a typical RNA-Seq experiment and consists of the same six samples, with no bar coding, and does not permit partitioning of batch and lane effects from the estimate of within-group biological variability.
F<sc>igure</sc> 5.—
Figure 5.—
A balanced incomplete block design (BIBD) for three treatment groups (T1, T2, T3) with one subject per treatment group (T11, T21, T31) and two technical replicates of each (T111, T112, T211, T212, T311, T312). After fragmentation, each of the three samples is bar coded and divided in two (e.g., T11 would be split into T111 and T112) and then pooled and sequenced as illustrated (e.g., T111 is pooled with T212 as input to lane 1).
F<sc>igure</sc> 6.—
Figure 6.—
A design based on three biological replicates within seven treatment groups. For each of the three flow cells there are eight lanes per flow cell and a control (formula image) sample in lane 5. Tij refers to the formula image replicate in the formula image treatment group formula image. In this design the flow cells form balanced complete blocks, and the lanes form balanced incomplete blocks.
F<sc>igure</sc> 7.—
Figure 7.—
Four designs (A–D) are compared in the simulation study for treatments formula image and formula image. Design A is a biologically unreplicated unblocked design with one subject for treatment group formula image and one subject for treatment group formula image. Design B is a biologically unreplicated balanced block design with formula image split (bar coded) into two technical replicates formula image and formula image split into two technical replicates formula image and input to lanes 1 and 2. Design C is a biologically replicated unblocked design with three subjects from treatment group formula image and three subjects from treatment group formula image. Design D is a biologically replicated balanced block design with each subject (e.g., formula image) split (bar coded) into six technical replicates (e.g., formula image) and input to six lanes.
F<sc>igure</sc> 8.—
Figure 8.—
ROC curves for the within-group variability setting formula image. The x-axis represents the false positive rate and the y-axis represents the true positive rate. The four panels of the graph show results for each of the four simulation settings. The ROC curve for the unblocked unreplicated design (A) is in solid red, for the blocked unreplicated design (B) is in dotted red, for the unblocked replicated design (C) is in solid blue, and for the blocked replicated design (D) is in dotted blue. The replicated designs always outperform the unreplicated designs, and whenever there is a batch effect or a lane effect, the blocked designs outperform their unblocked counterparts.

Similar articles

Cited by

References

    1. Agresti, A., 2002. Categorical Data Analysis, Ed. 2. Wiley, Hoboken, NJ.
    1. Alkan, C., J. M. Kidd, T. Marques-Bonet, G. Aksay, F. Antonacci et al., 2009. Personalized copy number and segmental duplication maps using next-generation sequencing. Nat. Genet. 41 1061–1067. - PMC - PubMed
    1. Audic, S., and J. Claverie, 1997. The significance of digital gene expression profiles. Genome Res. 7 986–995. - PubMed
    1. Baggerly, K. A., L. Deng, J. S. Morris and C. M. Aldaz, 2004. Overdispersed logistic regression for SAGE: modelling multiple groups and covariates. BMC Bioinformatics 5 144. - PMC - PubMed
    1. Balwierz, P. J., P. Carninci, C.O. Daub, J. Kawai, Y. Hayashizaki et al., 2009. Methods for analyzing deep sequencing expression data: constructing the human and mouse promoterome with deepCAGE data. Genome Biol. 10 R79. - PMC - PubMed

Publication types