. 2010 May 18;121(19):2092-101.
doi: 10.1161/CIRCULATIONAHA.109.901678. Epub 2010 May 3.

Natural history of experimental coronary atherosclerosis and vascular remodeling in relation to endothelial shear stress: a serial, in vivo intravascular ultrasound study

Affiliations

Natural history of experimental coronary atherosclerosis and vascular remodeling in relation to endothelial shear stress: a serial, in vivo intravascular ultrasound study

Konstantinos C Koskinas et al. Circulation. .

Abstract

Background: The natural history of heterogeneous atherosclerotic plaques and the role of local hemodynamic factors throughout their development are unknown. We performed a serial study to assess the role of endothelial shear stress (ESS) and vascular remodeling in the natural history of coronary atherosclerosis.

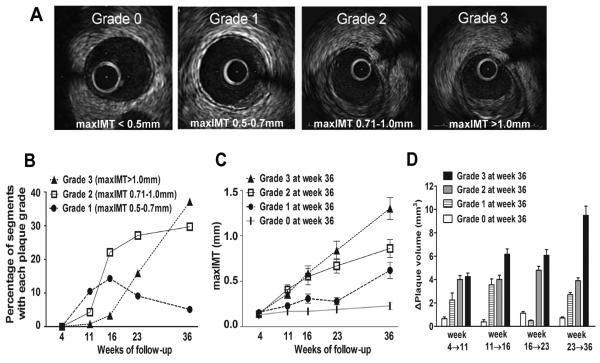
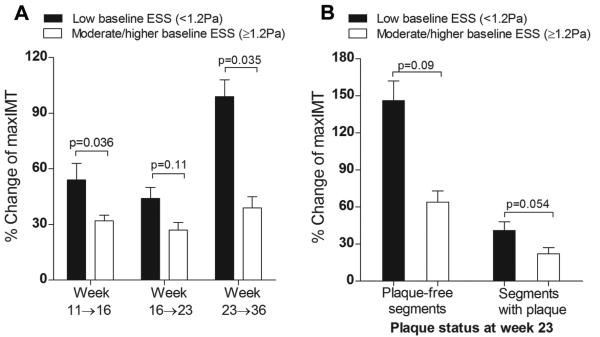
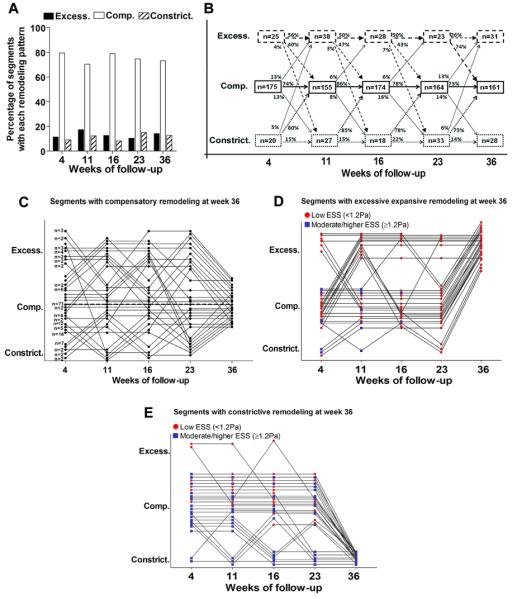
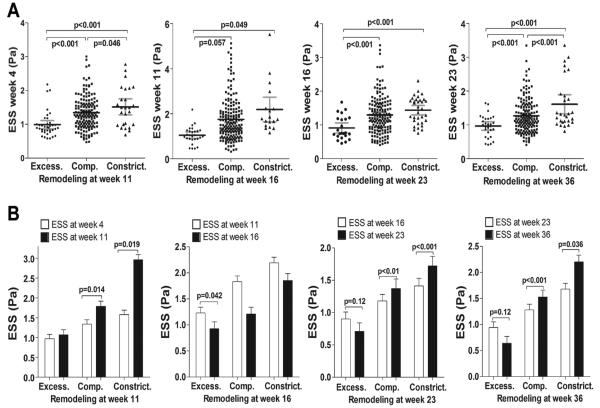
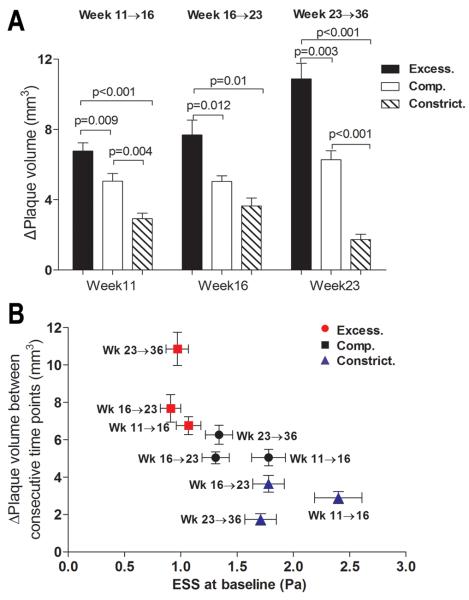
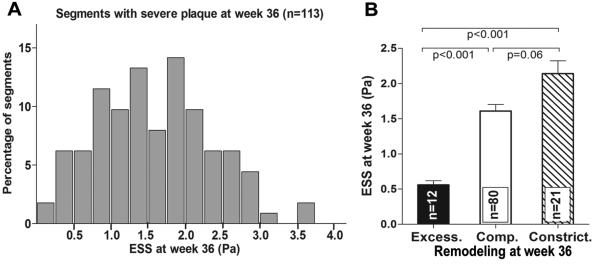
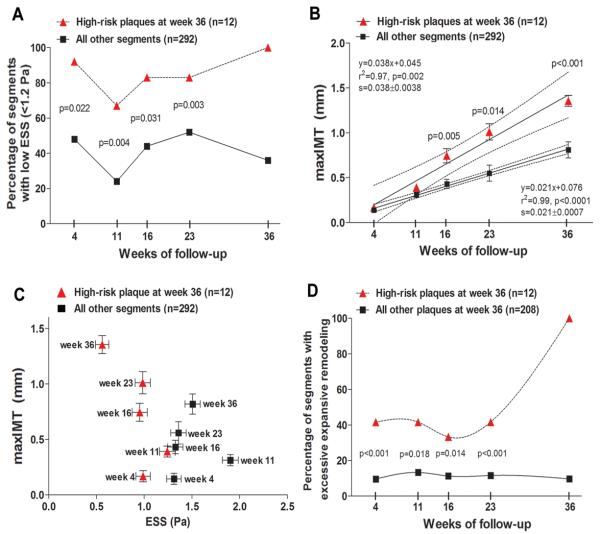
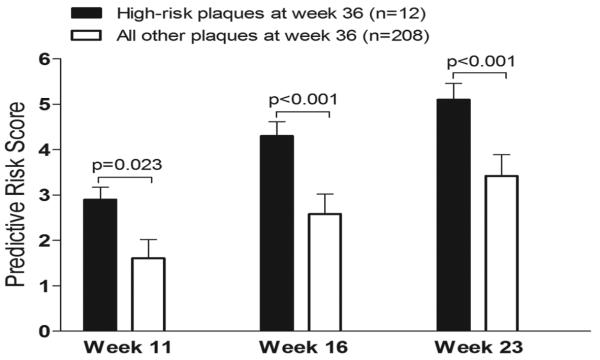
Methods and results: Intravascular ultrasound-based 3-dimensional reconstruction of all major coronary arteries (n=15) was performed serially in vivo in 5 swine 4, 11, 16, 23, and 36 weeks after induction of diabetes mellitus and hyperlipidemia. The reconstructed arteries were divided into 3-mm-long segments (n=304). ESS was calculated in all segments at all time points through the use of computational fluid dynamics. Vascular remodeling was assessed at each time point in all segments containing significant plaque, defined as maximal intima-media thickness >/=0.5 mm, at week 36 (n=220). Plaque started to develop at week 11 and progressively advanced toward heterogeneous, multifocal lesions at all subsequent time points. Low ESS promoted the initiation and subsequent progression of plaques. The local remodeling response changed substantially over time and determined future plaque evolution. Excessive expansive remodeling developed in regions of very low ESS, further exacerbated the low ESS, and was associated with the most marked plaque progression. The combined assessment of ESS, remodeling, and plaque severity enabled the early identification of plaques that evolved to high-risk lesions at week 36.

Conclusions: The synergistic effect of local ESS and the remodeling response to plaque formation determine the natural history of individual lesions. Combined in vivo assessment of ESS and remodeling may predict the focal formation of high-risk coronary plaque.


Figures

Figure 1
Figure 1
A, Representative examples of each grade of plaque severity. Segments were categorized according to maxIMT by IVUS into 4 grades of plaque severity: grade 0 (<0.5mm), grade 1 (0.5-0.7mm), grade 2 (0.71-1.0mm) and grade 3 (>1.0mm). B, Evolution of plaque severity over time. C, Evolution of maxIMT at all preceding time points in segments which resulted in each grade of plaque severity at week 36. D, Change of plaque volume (ΔPV) during the four consecutive intervals of follow-up in segments culminating in each grade of plaque severity at week 36.
Figure 2
Figure 2
A, Progression of plaque severity, assessed by relative change of maxIMT (%Δmax IMT) between consecutive time points in relation to baseline ESS. Segments exposed to low ESS (<1.2Pa) at weeks 11, 16 and 23 exhibited greater relative increase of maxIMT between weeks 11→16, 16→23 and 23→36, respectively, compared to segments with moderate/higher baseline ESS (≥1.2 Pa). B, Progression of plaque severity following week 23 was more marked in segments of low vs. moderate/higher ESS at week 23, both in plaque-free segments (maxIMT<0.5mm) and in segments that already contained significant plaque (maxIMT≥0.5mm) at this time point.
Figure 3
Figure 3
A, Frequency of the three remodeling patterns over time in segments that developed significant plaque (maxIMT≥0.5mm) by week 36 (n=220). B, Individual segments often evolved through different remodeling patterns throughout their natural history. The majority of segments with compensatory remodeling remained with that remodeling pattern over time. Only a small minority of segments with either excessive expansive, or constrictive remodeling at week 4, continued to exhibit the same remodeling pattern throughout their evolution. C, Individual remodeling trajectories of segments that culminated in compensatory remodeling at week 36 (n=161). Each dot represents an individual segment, or a group of segments that followed the same trajectory of remodeling evolution, as denoted by the number next to dots at week 4. Seventy one segments (44%) followed a trajectory of continuous compensatory remodeling throughout their evolution (dotted line). D, E, Individual remodeling trajectories of segments that culminated in excessive expansive remodeling (n=31) (D) and constrictive remodeling (n=28) (E) at week 36. Each dot represents an individual segment. Red dots denote low ESS (<1.2Pa), while blue dots represent moderate/higher ESS (≥1.2 Pa) for any segment at any given time point.
Figure 4
Figure 4
A, Local ESS at weeks 4, 11, 16 and 23 in segments categorized by the remodeling pattern at the immediately following time point, i.e. week 11, 16, 23 and 36, respectively. At all time points, segments with excessive expansive remodeling had significantly lower preceding ESS compared to segments with compensatory or constrictive remodeling. B, Impact of each remodeling pattern on local ESS. For segments with each remodeling pattern at all time points, local ESS at any given time point of remodeling assessment is compared to the local ESS at the immediately preceding time point. ESS generally tended to further decrease in segments with excessive expansive remodeling, and increased in segments with compensatory, or constrictive remodeling.
Figure 5
Figure 5
A, Plaque progression, assessed by change in plaque volume (ΔPV), between consecutive time points, in relation to the baseline remodeling pattern. B, Plaque progression (ΔPV) for segments with each baseline remodeling pattern plotted against baseline ESS, for time intervals week 11→16, week 16→23 and week 23→36. Horizontal and vertical lines represent S.E.M. of ESS and ΔPV, respectively.
Figure 6
Figure 6
A, Frequency distribution of ESS in segments with severe plaque at week 36, defined as maxIMT>1.0mm by IVUS. B, ESS at week 36 in segments with severe plaque and excessive expansive (excess.), compensatory (comp.) or constrictive remodeling (constrict.) at week 36.
Figure 7
Figure 7
A, Percentage of segments with low ESS (<1.2 Pa) over time in segments that culminated in high-risk plaque at week 36, defined as the combination of maxIMT>1.0mm and excessive expansive remodeling at week 36, vs. all other coronary segments. B, maxIMT over time in segments that culminated in high-risk plaque at week 36, vs. all other segments. Dashed lines represent 95% CI for the regression lines. The slopes of the two regression lines (0.038±0.0038 vs. 0.021±0.0007) are significantly different (p<0.0001). C, maxIMT at each time point plotted against ESS at the same time point in segments that culminated in high-risk plaque at week 36, vs. all other coronary segments. Values are presented as mean±SEM. D, Percentage of segments with excessive expansive remodeling over time in segments that culminated in high-risk plaque at week 36, vs. all other segments with significant plaque (maxIMT≥0.5mm) at week 36.
Figure 8
Figure 8
Association of the predictive risk score at preceding time points with status of plaque at week 36. Segments that culminated in high-risk plaque at week 36 displayed higher values of the risk score at preceding weeks 11, 16 and 23 compared to all other segments that developed significant plaque (maxIMT≥0.5mm) at week 36.

Similar articles

Cited by

References

    1. Chatzizisis YS, Coskun AU, Jonas M, Edelman ER, Feldman CL, Stone PH. Role of endothelial shear stress in the natural history of coronary atherosclerosis and vascular remodeling: molecular, cellular and vascular behavior. J Am Coll Cardiol. 2007;49:2379–2393. - PubMed
    1. Cheruvu PK, Finn AV, Gardner C, Caplan J, Goldstein J, Stone GW, Virmani R, Muller JE. Frequency and distribution of thin-cap fibroatheroma and ruptured plaques in human coronary arteries: a pathologic study. J Am Coll Cardiol. 2007;50:940–949. - PubMed
    1. Chatzizisis YS, Jonas M, Coskun AU, Beigel R, Stone BV, Maynard C, Gerrity RS, Daley W, Rogers C, Edelman ER, Feldman CL, Stone PH. Prediction of the localization of high risk coronary atherosclerotic plaques on the basis of low endothelial shear stress: an intravascular ultrasound and histopathology natural history study. Circulation. 2008;117:993–1002. - PubMed
    1. Stone PH, Coskun AU, Kinlay S, Popma JJ, Sonka M, Wahle A, Yeghiazarians Y, Maynard C, Kuntz RE, Feldman CL. Regions of low endothelial shear stress are sites where coronary plaque progress and vascular remodeling occurs in humans: an in-vivo serial study. Eur Heart J. 2007;28:705–710. - PubMed
    1. von Birgelen C, Hartmann M, Mintz GS, Böse D, Eggebrecht H, Neumann T, Gössl M, Wieneke H, Schmermund A, Stoel MG, Verhorst PM, Erbel R. Remodeling index compared to actual vascular remodeling in atherosclerotic left main coronary arteries as assessed with long-term (> or =12 months) serial intravascular ultrasound. J Am Coll Cardiol. 2006;47:1363–1368. - PubMed

Publication types

MeSH terms