. 2010 May 3;189(3):465-80.
doi: 10.1083/jcb.200910125.

Microtubule organization by the antagonistic mitotic motors kinesin-5 and kinesin-14

Affiliations

Microtubule organization by the antagonistic mitotic motors kinesin-5 and kinesin-14

Christian Hentrich et al. J Cell Biol. .

Abstract

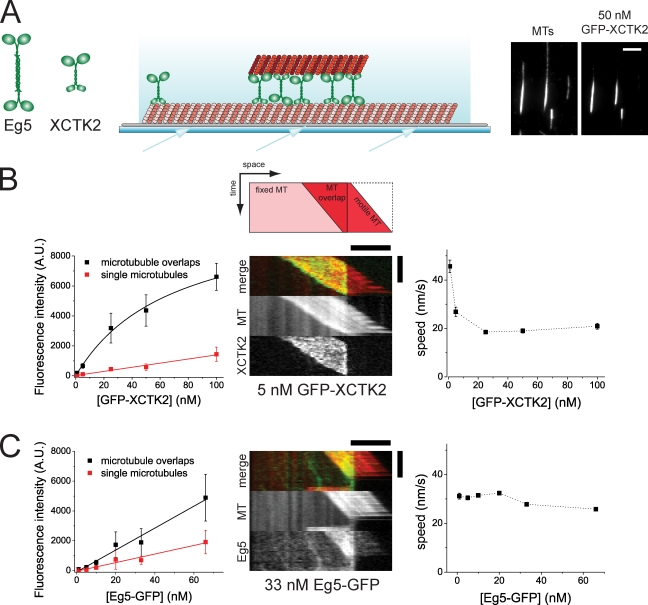
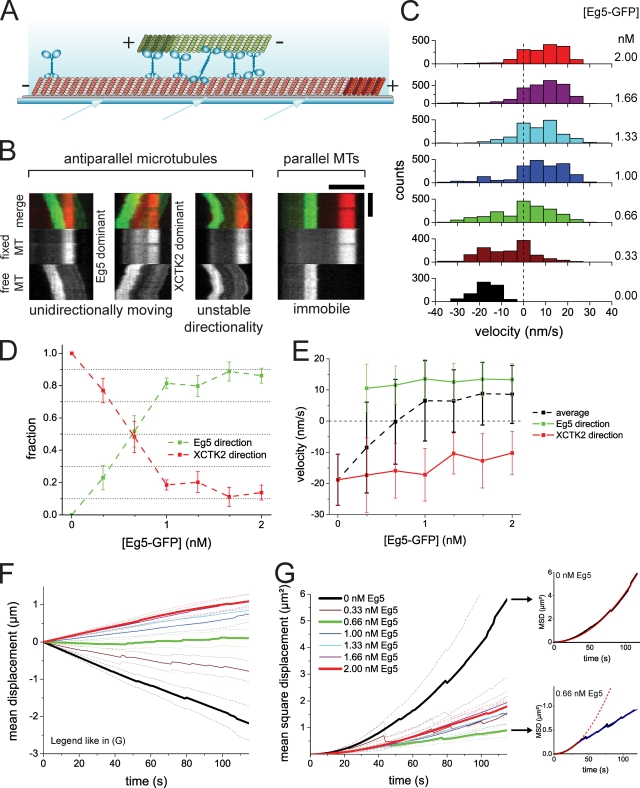
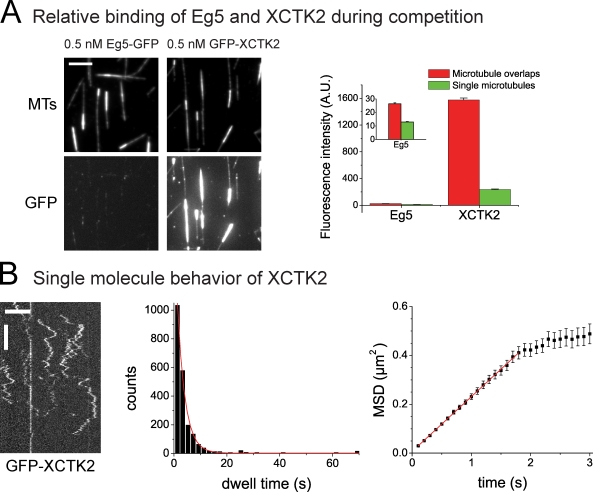
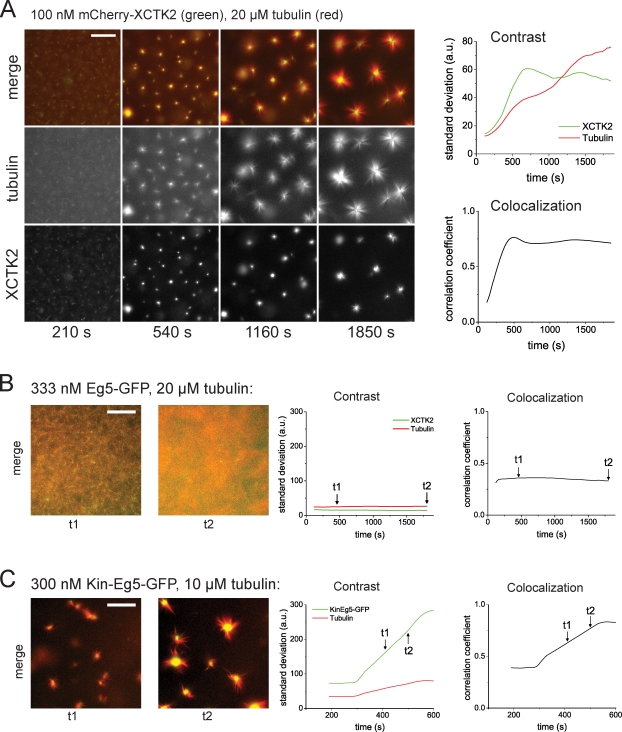
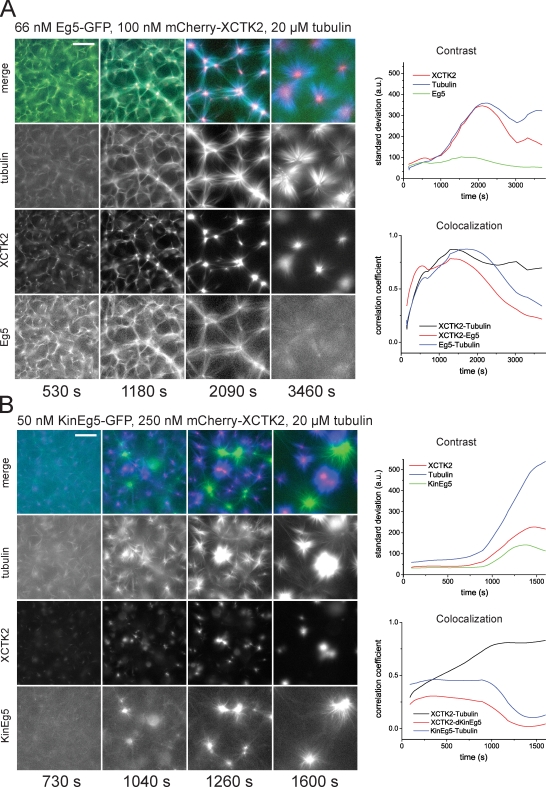
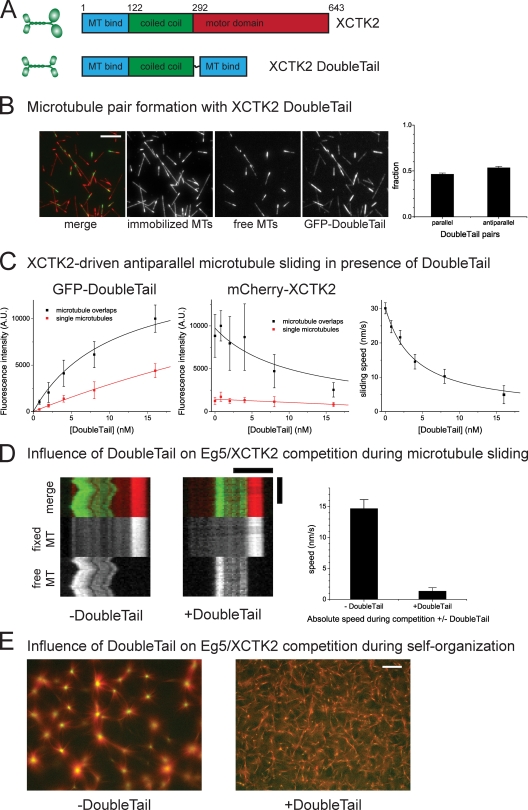
During cell division, different molecular motors act synergistically to rearrange microtubules. Minus end-directed motors are thought to have a dual role: focusing microtubule ends to poles and establishing together with plus end-directed motors a balance of force between antiparallel microtubules in the spindle. We study here the competing action of Xenopus laevis kinesin-14 and -5 in vitro in situations in which these motors with opposite directionality cross-link and slide microtubules. We find that full-length kinesin-14 can form microtubule asters without additional factors, whereas kinesin-5 does not, likely reflecting an adaptation to mitotic function. A stable balance of force is not established between two antiparallel microtubules with these motors. Instead, directional instability is generated, promoting efficient motor and microtubule sorting. A nonmotor microtubule cross-linker can suppress directional instability but also impedes microtubule sorting, illustrating a conflict between stability and dynamicity of organization. These results establish the basic organizational properties of these antagonistic mitotic motors and a microtubule bundler.


Figures

Figure 1.
Figure 1.
GFP-XCTK2 accumulates between microtubule pairs in contrast to Eg5-GFP. (A, left) Schematic representations of the molecular architectures of tetrameric plus end–directed motor Eg5 and dimeric minus end–directed motor XCTK2. Large round and small rectangular symbols indicate motor domains and nonmotor microtubule binding domains, respectively. (middle) Scheme of a microtubule pair in the sliding assay. Long, dimly fluorescently labeled, biotinylated microtubules are attached to a biotin-PEG–coated (gray) glass surface via neutravidin links. Short, brightly fluorescently labeled, unbiotinylated microtubules (top) are bound to the immobilized microtubules via cross-linking motor proteins. The arrows on the bottom indicate the incidence angle of the excitation light, which is totally internally reflected and gives rise to an evanescent field (light blue gradient). (right) TIRF microscopy images of Cy5-labeled microtubule (MT) pairs cross-linked by GFP-XCTK2 present in solution at a concentration of 50 nM, illustrating accumulation of GFP-XCTK2 in microtubule overlaps. (B) Quantification of GFP-XCTK2 in Cy5-microtubule pairs in assay buffer containing 120 mM KCl. (left) Binding curves showing averaged TIRF intensities of GFP-XCTK2 along microtubule overlaps and single microtubules at varying concentrations of GFP-XCTK2. The error bars are standard deviations, indicating the width of the fluorescence intensity distribution. The Kd for the binding of GFP-XCTK2 to the microtubule overlap derived from the fit is 69 ± 15 nM (error is standard error of the mean). (middle) Dual-color kymograph (see also the scheme on top) of XCTK2-driven microtubule pair sliding showing the GFP-XCTK2 signal in green and the Cy5-microtubule signal in red (separate channels are shown individually in bottom panels). The length of the overlap between the two microtubules is decreasing over time. A bright microtubule moving to the right is pushed over the end of an immobilized, dim microtubule; XCTK2 accumulation is confined to the overlap region. (right) Averaged speeds of microtubule sliding at varying concentrations of GFP-XCTK2. Error bars are standard errors of means. (C) Quantification of Eg5-GFP in Cy5-microtubule pairs in assay buffer containing 50 mM KCl. (left) Binding curves showing averaged TIRF intensities of Eg5-GFP along microtubule overlaps and single microtubules at varying concentrations of Eg5-GFP. Error bars are standard deviations. Absolute intensity values are not comparable with B (left) because the excitation intensity was increased. (middle) Dual-color kymograph of Eg5-driven microtubule pair sliding showing the Eg5-GFP signal in green and the Cy5-microtubule signal in red. (right) Averaged speeds of microtubule sliding at varying concentrations of Eg5-GFP. Error bars are standard errors of the mean. A.U., arbitrary unit. Bars: (A, B [horizontal], and C [horizontal]) 5 µm; (B and C, vertical) 120 s.
Figure 2.
Figure 2.
Competition of antagonistic motors in antiparallel microtubule sliding. (A) Scheme of a pair of polarity-marked microtubules in a sliding assay (symbols as in Fig. 1 A). (B) Different motility states of microtubule pairs. Example kymographs of a freely movable Alexa Fluor 568–microtubule (MT; green) bound via motor cross-links to a surface-immobilized Cy5-microtubule (red) in the presence of 0.5 nM XCTK2 and 0.66 nM Eg5-GFP, illustrating Eg5-dominated unidirectional antiparallel sliding, XCTK2-dominated unidirectional antiparallel sliding, movement with unstable directionality, and static parallel binding (from left to right). All kymographs are taken from the same sample. (C) Histograms of the instantaneous velocities of antiparallel sliding microtubules during the competition between 0.5 nM XCTK2 and varying concentrations of Eg5 (indicated to the right). Histograms contain all data of three independent experiments. (D) Fractions of Eg5-GFP– and XCTK2-dominated movement during microtubule sliding, calculated as described in Materials and methods. (E) Mean velocities of all microtubule movements and mean velocities separately determined for only the XCTK2-dominated microtubule movements and for the Eg5-GFP–dominated movements compiled from C. (F) Mean displacement curves of antiparallel sliding microtubules during the competition. Color code as in C and G. The highest, the lowest, and the balance point Eg5 concentrations are emphasized by thick lines. (G, left) MSD curves of antiparallel sliding microtubules. (top right) MSD curve of antiparallel sliding microtubules in the presence of 0.5 nM XCTK2 (black) fitted with a parabolic function (red). (bottom right) MSD curve of antiparallel sliding microtubules in the presence of 0.5 nM XCTK2 and 0.66 nM Eg5-GFP (black) fitted with a parabolic function (from 0 to 36 s; red) and a linear function (from 36 s onward; blue). The dashed lines show continuations of the fit equation in the data range that was not used for the fit. Error bars in D and E are standard errors of the mean. Dotted lines in F and G are 95% confidence intervals. All experiments shown were performed in assay buffer containing 50 mM KCl. Bars: (B, horizontal) 5 µm; (B, vertical) 120 s.
Figure 3.
Figure 3.
Comparison of relative affinity of XCTK2 and Eg5 and XCTK2 single molecule characterization of XCTK2. (A) Comparative quantification of the binding of GFP-XCTK2 and Eg5-GFP to single microtubules (MTs) and microtubule pairs (made with 0.5 nM unlabeled XCTK2) at identical conditions. (left) TIRF microscopy images of Cy5-microtubules (top) and of GFP-labeled motors as indicated (bottom) measured at identical microscopy settings for the two motors. (right) Averaged fluorescence intensities of the two GFP-labeled motors in microtubule overlaps and on single microtubules. A.U., arbitrary unit. (B) Single molecule TIRF microscopy of 0.02 nM GFP-XCTK2 on immobilized microtubules. (left) Kymographs showing binding events on an individual microtubule over time. (middle) Histogram showing the distribution of GFP-XCTK2 dwell times on microtubules and monoexponential fits (red line). The mean dwell time derived from this fit is τ = 2.86 ± 0.08 s. (right) MSD curve generated from 2,186 GFP-XCTK2 binding events and a linear fit (red line; R2 = 0.999). The initial linear increase of the MSD curve shows that XCTK2 does not move in a directional manner but diffuses via its nonmotor binding site on the microtubule. The one-dimensional diffusion coefficient D as derived from the slope of the fit (MSD = v2t2 = 2Dt) is D = 0.112 ± 0.001 µm2/s. (A and B) Stated errors and error bars are standard errors of the mean. All experiments shown were performed in assay buffer containing 50 mM KCl. Bars: (A and B [horizontal]) 5 µm; (B, vertical) 5 s.
Figure 4.
Figure 4.
Self-organization of microtubules and mitotic kinesins. (A) Self-organization of microtubules and XCTK2: time course of the formation of microtubule asters in the presence of 100 nM mCherry-XCTK2 and 20 µM tubulin. (left) Epifluorescence images of mCherry-XCTK2 and Cy5-tubulin taken at the indicated times in the individual color channels and as merged images. (right) Time course of organization monitored by image parameters: total contrast (top) for mCherry-XCTK2 images (green) and Cy5-microtubule images (red) as calculated by the standard deviation from the mean; colocalization (bottom) of mCherry-XCTK2 and Cy5-microtubule signals as calculated by Pearson’s correlation. (B) Self-organization of microtubules and Eg5. (left) Early (t1) and late (t2) example images illustrating the development of self-organization with Eg5-GFP (green) and Cy5-microtubules at the concentrations indicated. (right) The time course of self-organization is monitored by the standard deviation, which is indicative of contrast (left), and Pearson’s correlation coefficient, which is indicative of colocalization (right), for the color channels as indicated. The time points of the example images to the left are indicated in the curves with arrows. (C) Self-organization of microtubules and chimeric Kin-Eg5. Composition of the figure is as described in B. All experiments were performed in assay buffer with 50 mM KCl. a.u., arbitrary unit. Bars, 50 µm.
Figure 5.
Figure 5.
Self-organization of microtubules and antagonistic mitotic motors. (A) Competition between XCTK2 and wild-type Eg5 in self-organization of microtubules and motors. (left) Time course of the self-organization of mCherry-XCTK2 (red), Eg5-GFP (green), and Cy5-tubulin (blue) into asters with centrally accumulated mCherry-XCTK2; concentrations are as indicated. (right) Time course of self-organization as monitored by image parameters as in Fig. 4 A for the color channels as indicated. (B) Competition between XCTK2 and chimeric Kin-Eg5 in self-organization of microtubules and motors. (left) Time course of the self-organization of mCherry-XCTK2 (red), Kin-Eg5–GFP (green), and Cy5-tubulin (blue) into separate mCherry-XCTK2–containing asters and Kin-Eg5–GFP-containing asters; concentrations are as indicated. (right) Time course of self-organization as monitored by image parameters. All experiments shown were performed in assay buffer containing 50 mM KCl. a.u., arbitrary unit. Bars, 50 µm.
Figure 6.
Figure 6.
Effect of a nonmotor microtubule cross-linking protein on microtubule sliding and self-organization. (A) Schematic representations of XCTK2 and the DoubleTail construct. Numbers indicate amino acid position of the XCTK2 coding sequence. (B) GFP-DoubleTail cross-links microtubules (MTs). (left) Merged microtubule channels and individual color channels of microtubule pairs formed with 0.8 nM XCTK2 GFP-DoubleTail. (right) Fraction of microtubule pairs with parallel and antiparallel orientation. (C) Addition of XCTK2 GFP-DoubleTail to an antiparallel microtubule sliding assay with 1 nM mCherry-XCTK2 motor. (left) Binding of GFP-DoubleTail to single microtubules and to microtubule overlaps. (middle) GFP-DoubleTail competes with mCherry-XCTK2 for binding to microtubules. Black lines are global fits to the DoubleTail binding and competitive inhibition curves for microtubule overlaps with the shared fit parameter Kd for the DoubleTail binding to microtubule pairs, yielding a Kd of 10.4 ± 3.0 nM (error is standard error of the mean). (right) Increasing concentrations of GFP-DoubleTail decreases the sliding velocity. The black line is a fit assuming protein friction exerted by DoubleTail (see Materials and methods). A.U., arbitrary unit. (D, left) Typical kymographs of microtubule pairs in a motor competition experiment with 0.66 nM Eg5 and 0.5 nM XCTK2 in the absence or presence of 16 nM GFP-DoubleTail. (right) Quantification of the mean absolute sliding velocity of antiparallel microtubules under these conditions. (E) Self-organization of microtubules and antagonistic kinesins (100 nM mCherry-XCTK2 and 66 nM Eg5-GFP) in the absence or presence of 1 µM Z-GFP-DoubleTail. Merged images of microtubules (red) and mCherry-XCTK2 (green) after 36 min. Entire recorded time course is shown in Video 10. Error bars are standard errors of the mean (B, C [right], and D) or standard deviations (C, left and middle). Bars: (B) 10 µm; (D, horizontal) 5 µm; (D, vertical) 120 s; (E) 50 µm.

References

    1. Badoual M., Jülicher F., Prost J. 2002. Bidirectional cooperative motion of molecular motors. Proc. Natl. Acad. Sci. USA. 99:6696–6701 10.1073/pnas.102692399 - DOI - PMC - PubMed
    1. Berg H.C. 1993. Random Walks in Biology. Expanded edition Princeton University Press, Princeton, N.J: 152 pp
    1. Bieling P., Laan L., Schek H., Munteanu E.L., Sandblad L., Dogterom M., Brunner D., Surrey T. 2007. Reconstitution of a microtubule plus-end tracking system in vitro. Nature. 450:1100–1105 10.1038/nature06386 - DOI - PubMed
    1. Bieling P., Telley I.A., Piehler J., Surrey T. 2008. Processive kinesins require loose mechanical coupling for efficient collective motility. EMBO Rep. 9:1121–1127 10.1038/embor.2008.169 - DOI - PMC - PubMed
    1. Braun M., Drummond D.R., Cross R.A., McAinsh A.D. 2009. The kinesin-14 Klp2 organizes microtubules into parallel bundles by an ATP-dependent sorting mechanism. Nat. Cell Biol. 11:724–730 10.1038/ncb1878 - DOI - PubMed

Publication types