. 2010 May 3;189(3):511-25.
doi: 10.1083/jcb.201003006.

Osteopotentia regulates osteoblast maturation, bone formation, and skeletal integrity in mice

Affiliations

Osteopotentia regulates osteoblast maturation, bone formation, and skeletal integrity in mice

Michael L Sohaskey et al. J Cell Biol. .

Abstract

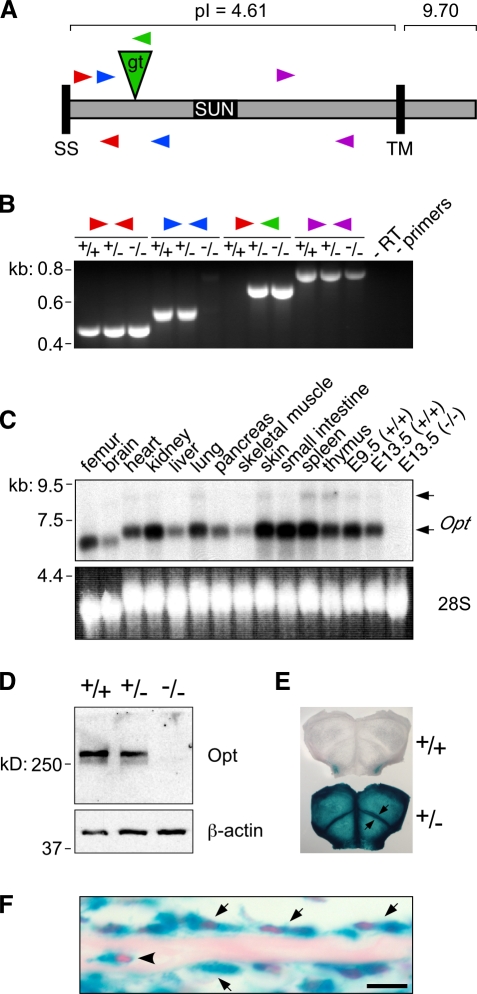
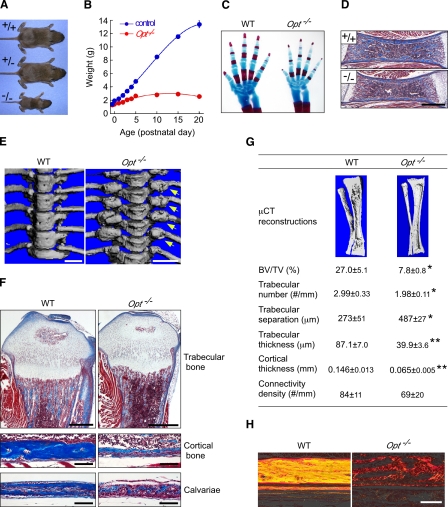
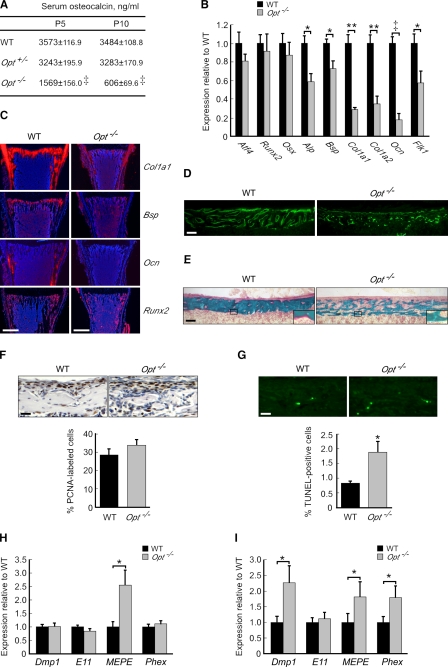
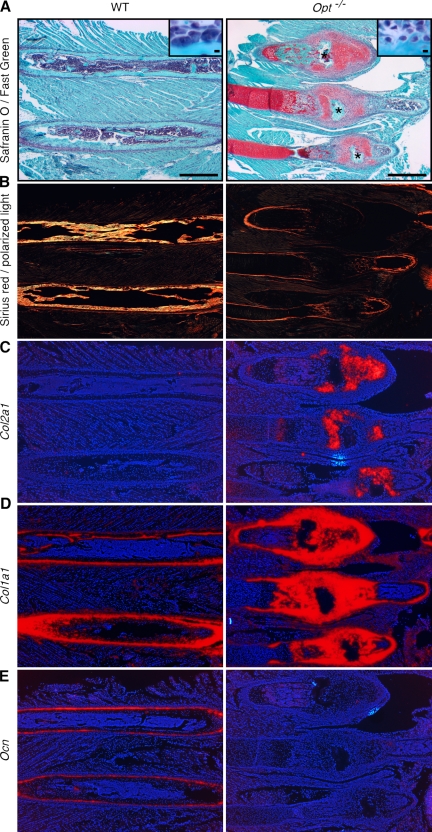
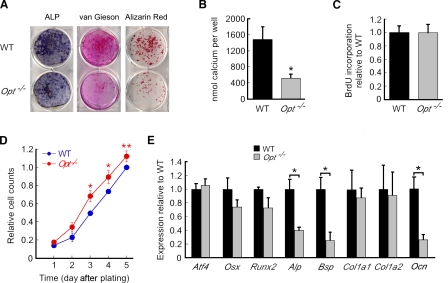
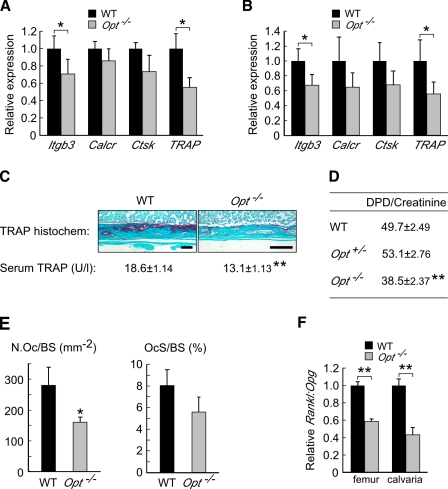
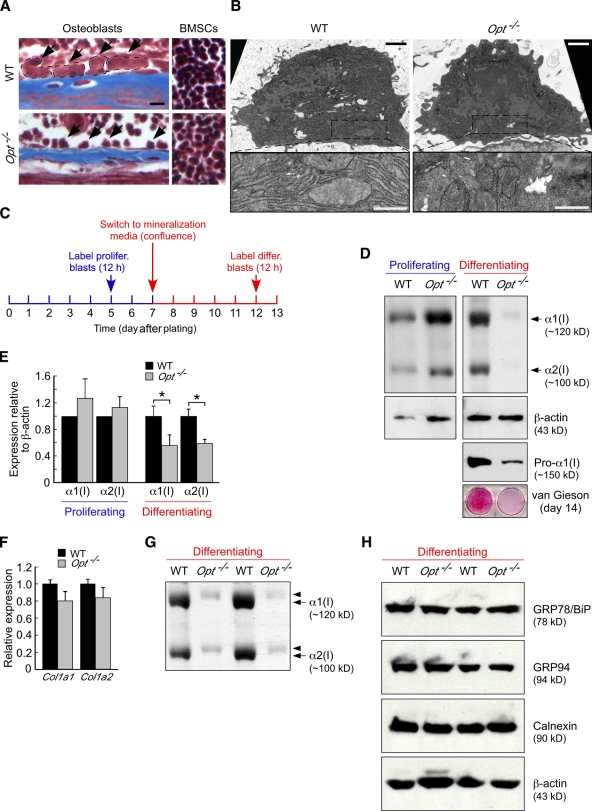
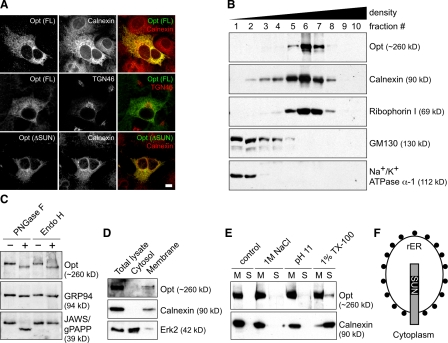
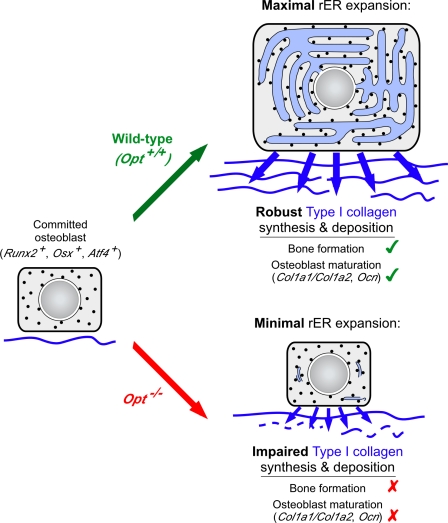
During skeletal development and regeneration, bone-forming osteoblasts respond to high metabolic demand by active expansion of their rough endoplasmic reticulum (rER) and increased synthesis of type I collagen, the predominant bone matrix protein. However, the molecular mechanisms that orchestrate this response are not well understood. We show that insertional mutagenesis of the previously uncharacterized osteopotentia (Opt) gene disrupts osteoblast function and causes catastrophic defects in postnatal skeletal development. Opt encodes a widely expressed rER-localized integral membrane protein containing a conserved SUN (Sad1/Unc-84 homology) domain. Mice lacking Opt develop acute onset skeletal defects that include impaired bone formation and spontaneous fractures. These defects result in part from a cell-autonomous failure of osteoblast maturation and a posttranscriptional decline in type I collagen synthesis, which is concordant with minimal rER expansion. By identifying Opt as a crucial regulator of bone formation in the mouse, our results uncover a novel rER-mediated control point in osteoblast function and implicate human Opt as a candidate gene for brittle bone disorders.


Figures

Figure 1.
Figure 1.
Identification, mutagenesis, and expression pattern of Opt. (A) Schematic of Opt protein domain organization, showing the position and orientation of the gene trap insertion (gt; green triangle) and RT-PCR primer–binding sites (arrowheads). The positions of the insertion and primer sites relative to the protein are shown primarily for illustrative purposes and are not drawn precisely to scale. SS, signal sequence; TM, putative transmembrane domain; pI, isoelectric point. (B) RT-PCR analysis of E13.5 embryos, confirming that Opt transcripts spanning the insertion site (blue arrowheads) are not detected in Opt−/− mice. Primers are shown as in A. +/+, WT; +/−, Opt +/−; −/−, Opt−/−. (C) Widespread Opt expression demonstrated by Northern blot analysis of tissue samples from 10-d-old mice and whole E9.5 and E13.5 embryos. Arrows indicate two specific transcripts (∼7.0 and 9.0 kb) that are absent from the E13.5 Opt−/− sample. 28S, EtBr-stained 28S ribosomal RNA. (D) Immunoblotting of E13.5 whole embryo lysates with Opt (top) or β-actin (bottom) antibodies. (E and F) Opt protein expression visualized as β-galactosidase staining in whole mount (E) and histological sections (F) of newborn calvaria. (E) Arrows indicate strong β-galactosidase staining at osteogenic fronts. (F) Arrows indicate Opt-expressing osteoblasts lining the bone surface, whereas the arrowhead indicates osteocyte expression. Bar, 10 µm.
Figure 2.
Figure 2.
Growth retardation and low bone mass with multiple fractures in Opt  −/− mice. (A) Gross morphology of WT, Opt  +/−, and Opt −/− mice at P10. (B) Growth curves for control (WT and Opt  +/−) and Opt −/− mice from E18.5 to P20. P < 0.0001 for all time points. (C) Cleared skeletal preparations of neonatal forelimbs stained with Alcian blue for cartilage and Alizarin red for bone. Note the delayed ossification of metacarpals and phalanges in the Opt −/− autopod. The mutant forelimb was digitally cut and moved within the same image using Photoshop to align it with and position it in closer proximity to the WT forelimb. (D) Longitudinal sections from P0 femurs stained with Masson’s trichrome to visualize collagen (blue) and muscle (red). Bar, 0.5 mm. (E) µCT reconstructions showing hyperplastic fracture calluses (arrows) at the costovertebral articulations of Opt −/− mice (P20). Bars, 1 mm. (F) Longitudinal sections from P10 tibiae (top and middle) and calvaria (bottom) stained with Masson’s trichrome. Bars: (top) 0.5 mm; (middle and bottom) 0.1 mm. (G) µCT reconstructions and bone structural parameters measured by quantitative µCT (n = 5). *, P < 0.05; **, P < 0.01. (H) Polarization microscopy of Sirius red–stained collagen fibers, showing abnormal birefringence of Opt −/− cortical bone. Bar, 0.1 mm.
Figure 3.
Figure 3.
Impaired osteoblast maturation in Opt−/− mice. (A) Serum osteocalcin levels expressed as ng/ml (n = 12). (B) qRT-PCR of osteoblast markers in femurs from P10 mice (n = 4). (C) Radioactive in situ hybridization on serial sections from distal femurs (P10). Bars, 0.5 mm. (D) Irregular calcein labeling of cortical bone surfaces in Opt−/− femurs (P10). (D–G) Bars, 0.1 mm. (E) Goldner’s trichrome staining of cortical bone in undecalcified femur sections (P10). Higher magnification insets of the boxed regions show decreased osteoid production (pink) by Opt−/− osteoblasts. (F and G) PCNA immunohistochemistry (F) and TUNEL analysis (G) of cortical bone from P3 femurs. Data are expressed as PCNA-positive (brown) or TUNEL-positive (green) cells per total cell number (n = 5–6 mice/genotype). (H and I) qRT-PCR of osteocyte markers in femurs (H) and calvaria (I) from P10 mice. *, P < 0.05; **, P < 0.01; ‡, P < 0.0001. Error bars indicate SEM.
Figure 4.
Figure 4.
Hyperplastic fracture calluses in Opt−/− mice lack mature osteoblasts. Images show serial sections of three hyperplastic rib calluses (Opt−/−) or two corresponding intact ribs (WT) from P12 mice. (A) Safranin O/Fast green staining with hematoxylin counterstain. Central fracture sites are indicated by asterisks. Higher magnification insets show enlarged active osteoblasts lining the WT bone compared with smaller immature osteoblasts seen in mutant fracture calluses. Bars: (main images) 1 mm; (insets) 10 µm. (B) Polarization microscopy of Sirius red–stained collagen fibers, showing minimal woven bone formation in Opt−/− calluses. (C–E) Radioactive in situ hybridization for Col2a1 (C), Col1a1 (D), and Ocn (E). Note the robust Col1a1 expression but negligible Ocn expression in Opt−/− calluses.
Figure 5.
Figure 5.
Defective matrix deposition and bone formation by Opt−/− osteoblasts. (A) Primary calvarial osteoblasts were plated at equal densities and were grown to confluence before switching to mineralization media on day 0. Cultures were assayed for ALP activity or stained with van Gieson reagent (to stain collagen fibrils) on day 10, and bone nodules were visualized by Alizarin red staining on day 14. (B) Bone formation quantified as eluted Alizarin red stain (n = 5 independent experiments in triplicate). (C) BrdU incorporation by proliferating osteoblasts assayed on day 5 after plating. (D) Growth curves for WT and Opt−/− osteoblasts over 5 d (n = 3 independent experiments in triplicate). (E) qRT-PCR analysis of primary osteoblasts on day 7 of differentiation. *, P < 0.05; **, P < 0.01. Error bars indicate SEM.
Figure 6.
Figure 6.
Opt−/− mice exhibit diminished osteoclast function. (A and B) qRT-PCR of osteoclast markers in femurs (A; n = 4) and calvaria (B; n = 5) from P10 mice. (C) Decreased osteoclast-specific TRAP activity in Opt−/− bones assayed by histochemical staining (P10 tibial sections) and serum ELISA (P5 mice). Bars, 0.1 mm. (D) Urinary deoxypyridinoline (DPD) cross-links from P5 mice (n = 9–10). (E) Osteoclast number/bone surface (N.Oc/BS) and osteoclast surface/bone surface (OcS/BS) in femurs from P10 mice (n = 5). (F) Reduced ratio of Rankl to Opg expression in Opt−/− femurs and calvaria assessed by qRT-PCR. *, P < 0.05; **, P < 0.001.
Figure 7.
Figure 7.
Opt is essential for type I collagen synthesis in differentiating osteoblasts. (A) Masson’s trichrome staining of P10 tibial sections. Arrows indicate osteoblasts lining the endosteal bone surface (left), and WT osteoblasts are delineated by the dashed lines. Opt−/− osteoblasts are considerably smaller, whereas bone marrow stromal cells (BMSCs; right) are similar in size to WT. Bar, 10 µm. (B) Transmission electron microscopy of osteoblasts in P10 tibiae. (bottom) Higher magnification views of boxed regions show extensive, well-organized rER cisternae in WT that are absent in the more fibroblast-like Opt−/− cell. Bars: (top) 1 µm; (bottom) 0.5 µm. (C) Schematic timeline for metabolic labeling of osteoblasts. (D) 7% SDS-PAGE analysis of type I collagen synthesis by [3H]proline-labeled proliferating and differentiating osteoblast cultures (top). Radiolabeled collagen from the media fraction is shown, with loading normalized by sample volume rather than cell number. β-Actin and intracellular procollagen levels were assessed by immunoblotting, whereas van Gieson staining (bottom) confirms the sparse collagen matrix deposited by Opt−/− osteoblasts. (E) Quantification of type I collagen synthesis (α1 and α2 chains) by proliferating and differentiating osteoblasts normalized to β-actin control (n = 4 independent experiments in triplicate). *, P < 0.02. (F) qRT-PCR analysis of Col1a1 and Col1a2 expression in differentiating osteoblasts. (G) Overmodification of radiolabeled α1(I) and α2(I) collagen chains from differentiating Opt−/− osteoblasts, as indicated by their delayed electrophoretic migration. The autoradiogram shows radiolabeled collagen from the cellular fraction of duplicate cultures and represents an independent experiment from that shown in D. (H) Immunoblotting for the ER chaperones GRP78/BiP, GRP94, and calnexin in whole cell lysates of metabolically labeled, primary differentiating osteoblasts. β-Actin serves as a loading control. Results from two independent experiments are shown. Error bars indicate SEM.
Figure 8.
Figure 8.
Opt is a glycosylated integral membrane protein of the rER. (A) Indirect immunofluorescence of HA-tagged full-length (FL) and SUN domain–deleted (ΔSUN) Opt in transfected primary osteoblasts. Antibodies against calnexin and TGN46 were used to label the ER and Golgi, respectively. Bar, 10 µm. (B) Subcellular fractionation of mouse embryonic fibroblast lysate on a continuous (0–20%) iodixanol density gradient. 10 fractions were collected and analyzed by SDS-PAGE and immunoblotting. Ribophorin I, GM130, and Na+/K+ ATPase-α1 mark the rER, Golgi, and plasma membrane, respectively. (C) Opt is N-glycosylated. Denatured lysate was treated with buffer (−) or with the N-glycosidases PNGase F or Endo H (+), and samples were immunoblotted for Opt, the Endo H–sensitive ER glycoprotein GRP94, or the Endo H–resistant Golgi glycoprotein JAWS/gPAPP. (D) Cytosolic and membrane fractions were immunoblotted for the indicated proteins. (E) Membrane fractions were treated with buffer ± 1 M NaCl, 0.1 M Na2CO3, pH 11, or 1% Triton X-100 and recentrifuged. The resulting membrane (M) and soluble (S) fractions were immunoblotted for Opt or calnexin, an ER-integral membrane protein. (F) Diagram showing the proposed orientation of Opt in the rER membrane, with the SUN domain on the lumenal side. Black circles represent ribosomes.
Figure 9.
Figure 9.
Model for the Opt-dependent control of osteoblast function and bone formation. Opt at the rER membrane promotes bone formation by enabling maximal rER expansion and robust type I collagen synthesis. Collagen matrix deposition in turn potentiates osteoblast maturation, leading to bone mass accrual. Black circles represent ribosomes.

Similar articles

Cited by

References

    1. Aitchison K., Ogilvie D., Honeyman M., Thompson E., Sykes B. 1988. Homozygous osteogenesis imperfecta unlinked to collagen I genes. Hum. Genet. 78:233–236 10.1007/BF00291667 - DOI - PubMed
    1. Andrianarivo A.G., Robinson J.A., Mann K.G., Tracy R.P. 1992. Growth on type I collagen promotes expression of the osteoblastic phenotype in human osteosarcoma MG-63 cells. J. Cell. Physiol. 153:256–265 10.1002/jcp.1041530205 - DOI - PubMed
    1. Aronow M.A., Gerstenfeld L.C., Owen T.A., Tassinari M.S., Stein G.S., Lian J.B. 1990. Factors that promote progressive development of the osteoblast phenotype in cultured fetal rat calvaria cells. J. Cell. Physiol. 143:213–221 10.1002/jcp.1041430203 - DOI - PubMed
    1. Baker S.L. 1956. Fibrogenesis imperfecta ossium; a generalised disease of bone characterised by defective formation of the collagen fibres of the bone matrix. J. Bone Joint Surg. Br. 38-B:378–417 - PubMed
    1. Baker J., Liu J.P., Robertson E.J., Efstratiadis A. 1993. Role of insulin-like growth factors in embryonic and postnatal growth. Cell. 75:73–82 - PubMed

Publication types

Substances