. 2010 May 3;189(3):589-600.
doi: 10.1083/jcb.201003007.

N-cadherin mediates plasticity-induced long-term spine stabilization

Affiliations

N-cadherin mediates plasticity-induced long-term spine stabilization

Pablo Mendez et al. J Cell Biol. .

Abstract

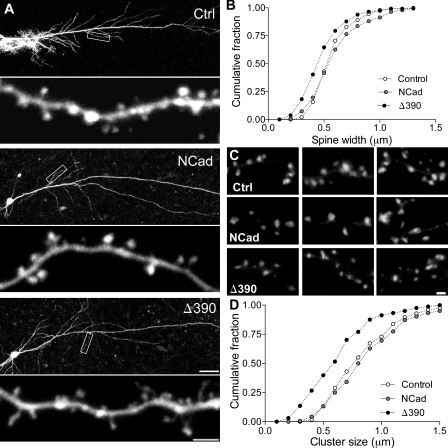
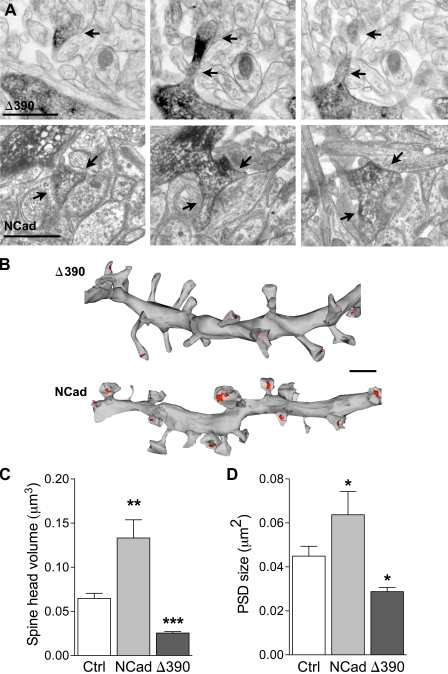
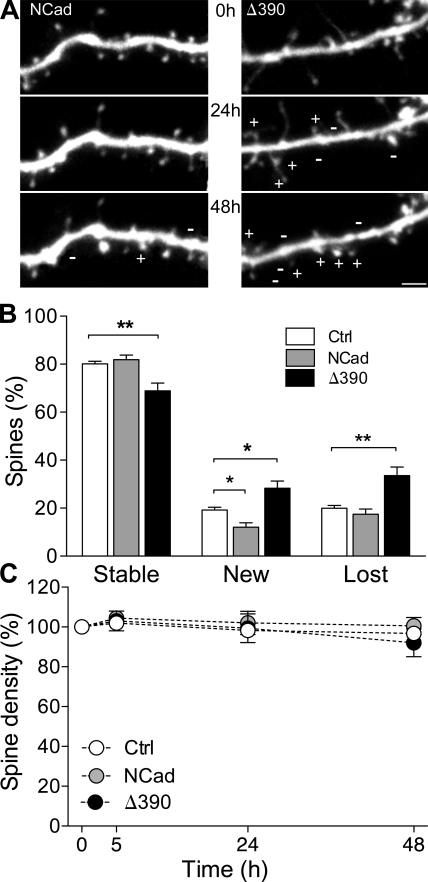
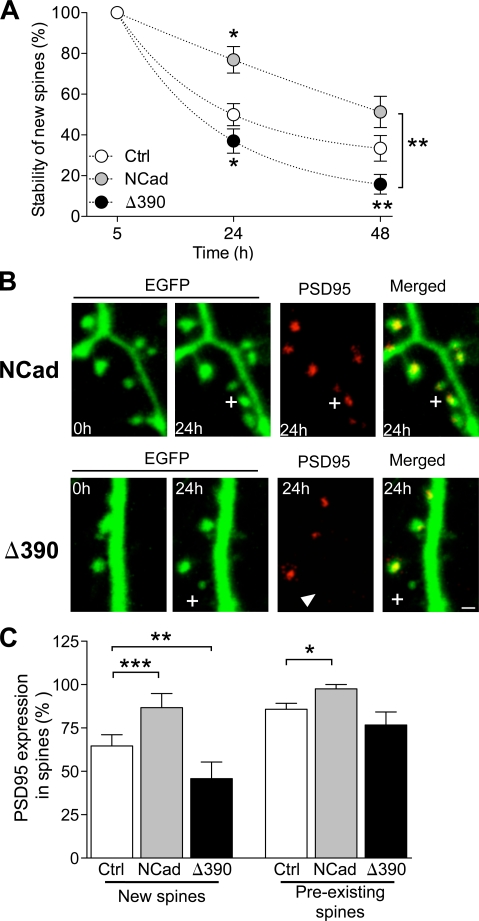
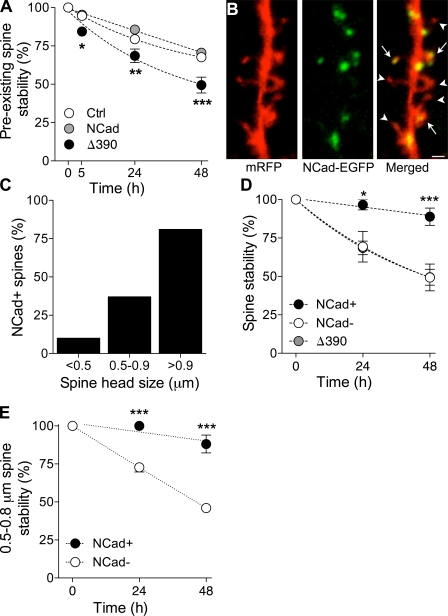
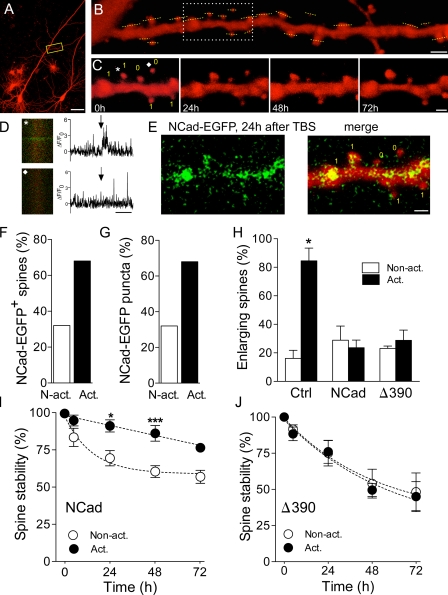
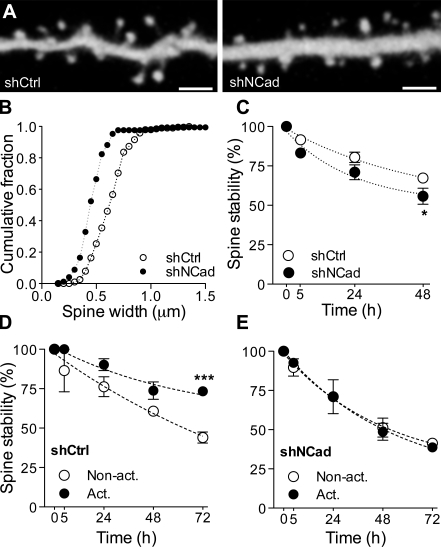
Excitatory synapses on dendritic spines are dynamic structures whose stability can vary from hours to years. However, the molecular mechanisms regulating spine persistence remain essentially unknown. In this study, we combined repetitive imaging and a gain and loss of function approach to test the role of N-cadherin (NCad) on spine stability. Expression of mutant but not wild-type NCad promotes spine turnover and formation of immature spines and interferes with the stabilization of new spines. Similarly, the long-term stability of preexisting spines is reduced when mutant NCad is expressed but enhanced in spines expressing NCad-EGFP clusters. Activity and long-term potentiation (LTP) induction selectively promote formation of NCad clusters in stimulated spines. Although activity-mediated expression of NCad-EGFP switches synapses to a highly stable state, expression of mutant NCad or short hairpin RNA-mediated knockdown of NCad prevents LTP-induced long-term stabilization of synapses. These results identify NCad as a key molecular component regulating long-term synapse persistence.


Figures

Figure 1.
Figure 1.
NCad regulates spine morphology and PSD size. (A) Dendritic segments from pyramidal CA1 neurons transfected with EGFP (Ctrl), EGFP + WT-NCad (NCad), or EGFP + the mutant Δ390-NCad (Δ390). Note the increased proportion of thin, immature-type spines in the cell transfected with Δ390-NCad. Boxes show the corresponding enlarged dendritic segments below. (B) Cumulative distribution of spine head width in the three conditions, indicating a shift to the left in Δ390-NCad cells (n = 5; P < 0.001; one-way ANOVA). (C) PSD-95–EGFP puncta in cells transfected with PSD-95–EGFP (Ctrl), PSD-95–EGFP + NCad (NCad), or PSD-95–EGFP + Δ390-NCad (Δ390). (D) Cumulative distribution of the size of PSD-95–EGFP puncta in the three conditions. Note the shift to the left in Δ390-NCad–transfected cells (n = 4; P < 0.001; one-way ANOVA). Bars: (A, top) 50 µm; (A, bottom) 2 µm; (C) 1 µm.
Figure 2.
Figure 2.
Regulation of spine ultrastructure by NCad. (A) Illustrations of dendritic spines (arrows) visualized on consecutive sections obtained from a dendritic segment of a pyramidal CA1 neuron transfected with EGFP + Δ390-NCad (Δ390) or EGFP + NCad (NCad). The transfected dendritic segment is revealed by anti-EGFP immunostaining. (B) 3D reconstruction of two dendritic segments obtained from cells transfected with EGFP + Δ390-NCad or EGFP + NCad. Note the differences in size of spine heads and PSD areas (red). (C and D) Quantitative analysis of spine head volume and PSD area obtained from 3D-reconstructed dendritic segments of CA1 pyramidal neurons transfected with EGFP (Ctrl), EGFP + NCad, or EGFP + Δ390-NCad. Data are mean ± SEM of three experiments per condition (110, 58, and 127 reconstructed spines analyzed; *, P < 0.05; **, P < 0.01; ***, P < 0.001; Mann-Whitney U test). Bars: (A) 1 µm; (B) 2 µm.
Figure 3.
Figure 3.
Modification of spine turnover by interference with NCad function. (A) Illustration of dendritic segments imaged repetitively at 24-h intervals and obtained from an EGFP + NCad (NCad)– and an EGFP + Δ390-NCad (Δ390)–transfected cell. Plus and minus signs indicated newly formed or lost spines, respectively. (B) Fraction of stable, newly formed, and lost spines detected over periods of 24 h in EGFP (Ctrl)-, EGFP + NCad–, or EGFP + Δ390-NCad–transfected cells. Data are mean ± SEM of 9–23 experiments (1,166, 449, and 523 spines analyzed, respectively; *, P < 0.05; **, P < 0.01; two-way ANOVA with Bonferroni posttest). (C) Changes in spine turnover are not associated with modifications of spine density in the three conditions tested. Data are mean ± SEM of 9–23 experiments. Bar, 2 µm.
Figure 4.
Figure 4.
NCad regulates the long-term stabilization of newly formed spines. (A) Stability over the next 2 d of new spines formed during an interval of 5 h in EGFP (Ctrl)-, EGFP + NCad (NCad)–, and EGFP + Δ390-NCad (Δ390)–transfected cells. Data are mean ± SEM of the proportion of spines still present at the indicated times (n = 5–16; 23, 15, and 50 new spines analyzed; *, P < 0.05; **, P < 0.01; two-way ANOVA with Bonferroni posttest). (B) Expression of DsRed2-tagged PSD-95 in newly formed spines (plus signs) observed in EGFP + NCad– or EGFP + Δ390-NCad–transfected neurons. Note that the new spine illustrated in the NCad condition expresses a DsRed2–PSD-95 puncta, but not the one in Δ390-NCad (arrowhead). (C) Fraction of new spines formed in an interval of 24 h (new spines) and of spines older than 24 h (preexisting spines) that expressed DsRed2–PSD-95 puncta in the three conditions tested. Data are mean ± SEM of 4–5 experiments (26, 13, and 19 new spines analyzed and 140, 82, and 75 stable spines analyzed in five control, four NCad, and five Δ390-NCad experiments, respectively; *, P < 0.05; **, P < 0.01; ***, P < 0.001; two-way ANOVA with Bonferroni posttest). Bar, 1 µm.
Figure 5.
Figure 5.
NCad expression promotes long-term spine stability. (A) Stability of preexisting spines assessed as the proportion of spine still present on the next 2 d. Data are mean ± SEM of 17, 11, and 9 experiments performed in cells transfected with EGFP (Ctrl), EGFP + NCad (NCad), or EGFP + Δ390-NCad (Δ390; 547, 349, and 358 spines analyzed; *, P < 0.05; **, P < 0.01; ***, P < 0.001; two-way ANOVA with Bonferroni posttest). (B) Expression of EGFP-tagged NCad in a cell transfected with mRFP. Note that several spines express puncta (arrows), whereas others do not (arrowheads). (C) Proportion of spines expressing NCad-EGFP as a function of the spine head size. Data are the mean of six experiments (125 spines analyzed). (D) Long-term stability of spines as a function of NCad-EGFP expression. For comparison, the graph also shows the stability of spines in Δ390-NCad–transfected cells. Data are mean ± SEM of six experiments (125 spines analyzed; *, P < 0.01; ***, P < 0.001; two-way ANOVA with Bonferroni posttest). (E) Long-term stability as a function of NCad-EGFP expression for spines of sizes between 0.5 and 0.8 µm. Data are mean ± SEM of six experiments (58 spines analyzed; ***, P < 0.001; two-way ANOVA with Bonferroni posttest). Bar, 1 µm.
Figure 6.
Figure 6.
NCad is selectively expressed in potentiated synapses and is required for their long-term stabilization. (A) Illustration of an mRFP-transfected pyramidal neuron with the localization of a dendritic segment analyzed in B and C. The box shows the dendritic segment enlarged in B. (B) The mRFP-transfected cell in A was loaded with Fluo4-AM through bolus loading, and spines were tested using line scans (yellow dashed lines) for their response to stimulation pulses applied in the CA3 area. The delimited region shows the portion of dendrite illustrated in C. (C) Repetitive imaging at 24-h intervals of the same dendritic segment. The yellow number indicate whether the spines were activated (1) or not (0) by the stimulation pulses applied to CA3 neurons. The asterisk and the diamond show the localization of the spines in which the calcium signals illustrated in D were recorded. (D) Line scans obtained in the spines indicated by an asterisk or diamond in C. The graph shows the ΔF/F0 values for the corresponding line scans. Arrows indicate stimulation. (E) NCad-EGFP fluorescence (left) and signal merged with the mRFP fluorescence (merge) observed on the same dendritic segment 24 h after theta burst stimulation (TBS). Note that no NCad-EGFP fluorescence was detectable at time 0 (not depicted). The yellow numbers indicate which spines were activated (1) or not (0) by theta burst stimulation. (F) Proportion of activated (act.) and nonactivated (N-act.) spines expressing NCad-EGFP 24 h after theta burst stimulation (n = 31 activated and 29 nonactivated spines out of three experiments). (G) Proportion of NCad-EGFP puncta that appeared in activated versus nonactivated spines (n = 29 new puncta in three experiments). (H) Proportion of activated and nonactivated spines (mean ± SEM) that showed an enlargement of their spine head 5 h after theta burst stimulation (n = 4–6 experiments; 79, 168, and 122 spines analyzed in control [Ctrl]-, NCad-, and Δ390-NCad–transfected cells; *, P < 0.05; t test). (I) Stability of activated and nonactivated spines analyzed as the proportion of them still present on consecutive days in cells transfected with WT-NCad. Data are mean ± SEM of eight experiments (114 activated and 90 nonactivated spines analyzed; *, P < 0.05; ***, P < 0.001; two-way ANOVA with Bonferroni posttest). (J) Same as in I but for cells transfected with Δ390-NCad (n = 5; 55 activated and 67 nonactivated spines analyzed; P > 0.05; two-way ANOVA with Bonferroni posttest). Bars: (A) 100 µm; (B) 2 µm; (C and E) 1 µm; (D) 1 s.
Figure 7.
Figure 7.
Knockdown of NCad interferes with plasticity-induced spine stabilization. (A) Illustration of dendritic segments of pyramidal neurons cotransfected with mRFP and either control shRNA (left) or shRNA against NCad (right). (B) Expression of an shRNA against NCad (shNCad; n = 7 cells) results in a decrease in spine head width when compared with expression of a control shRNA (shCtrl; n = 6 cells). (C) The stability of spines of cells transfected with shNCad (n = 4) was reduced as compared with cells transfected with shCtrl (n = 7; mean ± SEM; *, P < 0.05; two-way ANOVA with Bonferroni posttest). (D) LTP induces an increased stabilization of activated spines (Act.) versus nonactivated spines (Non-act.) in cells transfected with shCtrl. Data are mean ± SEM of three experiments (79 spines analyzed; ***, P < 0.001; two-way ANOVA with Bonferroni posttest). (E) In contrast, LTP did not promote a selective stabilization of activated spines versus nonactivated ones in cells transfected with shNCad (n = 4; 86 spines analyzed; mean ± SEM). Bars, 2 µm.

Comment in

  • N-cadherin: stabilizing synapses.
    Arikkath J. Arikkath J. J Cell Biol. 2010 May 3;189(3):397-8. doi: 10.1083/jcb.201004022. J Cell Biol. 2010. PMID: 20439992 Free PMC article.

References

    1. Abe K., Chisaka O., Van Roy F., Takeichi M. 2004. Stability of dendritic spines and synaptic contacts is controlled by alpha N-catenin. Nat. Neurosci. 7:357–363 10.1038/nn1212 - DOI - PubMed
    1. Arikkath J., Reichardt L.F. 2008. Cadherins and catenins at synapses: roles in synaptogenesis and synaptic plasticity. Trends Neurosci. 31:487–494 10.1016/j.tins.2008.07.001 - DOI - PMC - PubMed
    1. Arikkath J., Peng I.F., Ng Y.G., Israely I., Liu X., Ullian E.M., Reichardt L.F. 2009. Delta-catenin regulates spine and synapse morphogenesis and function in hippocampal neurons during development. J. Neurosci. 29:5435–5442 10.1523/JNEUROSCI.0835-09.2009 - DOI - PMC - PubMed
    1. Bozdagi O., Shan W., Tanaka H., Benson D.L., Huntley G.W. 2000. Increasing numbers of synaptic puncta during late-phase LTP: N-cadherin is synthesized, recruited to synaptic sites, and required for potentiation. Neuron. 28:245–259 10.1016/S0896-6273(00)00100-8 - DOI - PubMed
    1. De Roo M., Klauser P., Mendez P., Poglia L., Muller D. 2008a. Activity-dependent PSD formation and stabilization of newly formed spines in hippocampal slice cultures. Cereb. Cortex. 18:151–161 10.1093/cercor/bhm041 - DOI - PubMed

Publication types