

Counter-intuitive stochastic behavior of simple gene circuits with negative feedback
- PMID: 20441737
- PMCID: PMC2862162
- DOI: 10.1016/j.bpj.2010.01.018
Counter-intuitive stochastic behavior of simple gene circuits with negative feedback
Abstract
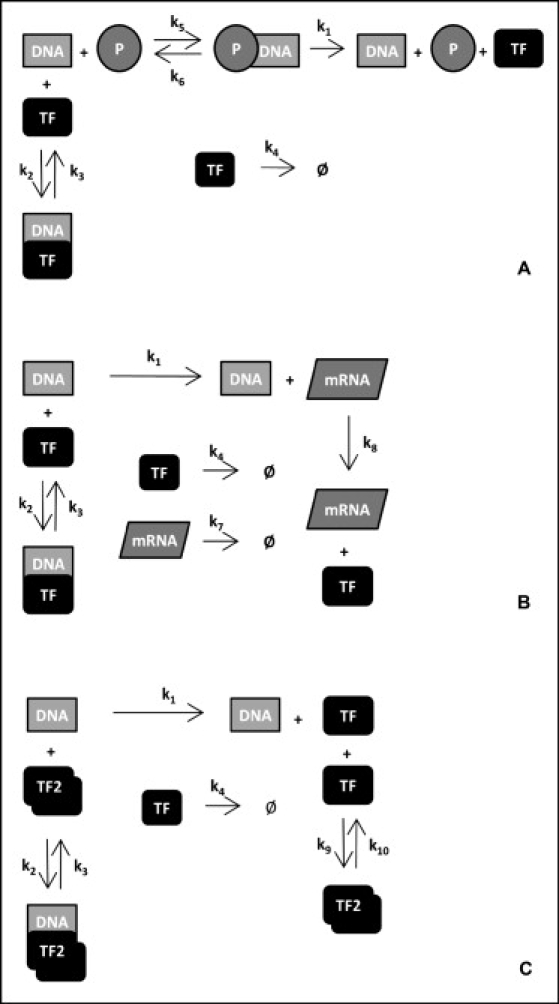
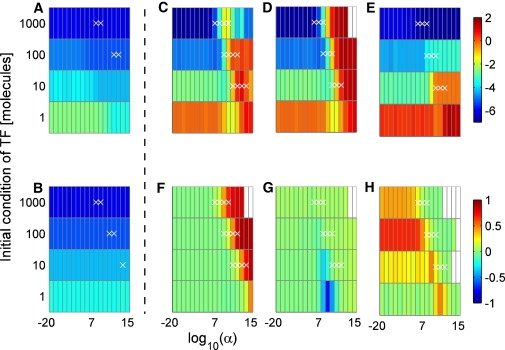
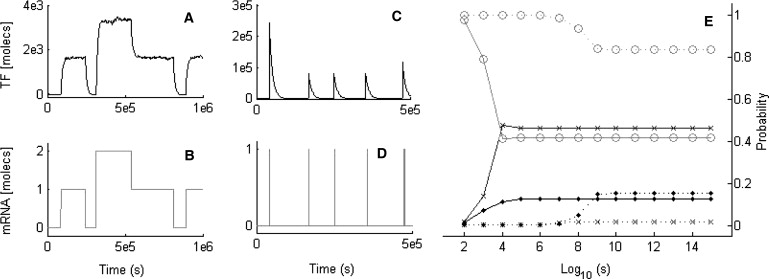
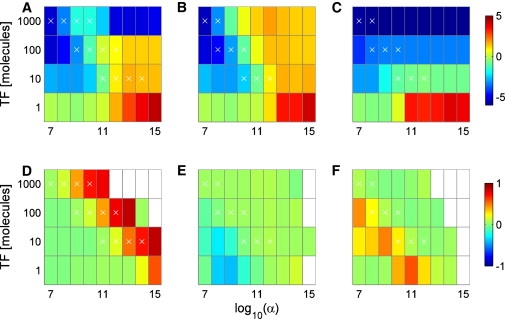
It has often been taken for granted that negative feedback loops in gene regulation work as homeostatic control mechanisms. If one increases the regulation strength a less noisy signal is to be expected. However, recent theoretical studies have reported the exact contrary, counter-intuitive observation, which has left a question mark over the relationship between negative feedback loops and noise. We explore and systematically analyze several minimal models of gene regulation, where a transcriptional repressor negatively regulates its own expression. For models including a quasi-steady-state assumption, we identify processes that buffer noise change (RNA polymerase binding) or accentuate it (repressor dimerization) alongside increasing feedback strength. Moreover, we show that lumping together transcription and translation in simplified models clearly underestimates the impact of negative feedback strength on the system's noise. In contrast, in systems without a quasi-steady-state assumption, noise always increases with negative feedback strength. Hence, subtle mathematical properties and model assumptions yield different types of noise profiles and, by consequence, previous studies have simultaneously reported decrease, increase or persistence of noise levels with increasing feedback. We discuss our findings in terms of separation of timescales and time correlations between molecular species distributions, extending current theoretical findings on the topic and allowing us to propose what we believe new ways to better characterize noise.
Copyright (c) 2010 Biophysical Society. Published by Elsevier Inc. All rights reserved.
Figures
Similar articles
-
Delays induce novel stochastic effects in negative feedback gene circuits.Biophys J. 2014 Jan 21;106(2):467-78. doi: 10.1016/j.bpj.2013.12.010. Biophys J. 2014. PMID: 24461022 Free PMC article.
-
Negative feedback through mRNA provides the best control of gene-expression noise.IEEE Trans Nanobioscience. 2011 Sep;10(3):194-200. doi: 10.1109/TNB.2011.2168826. IEEE Trans Nanobioscience. 2011. PMID: 22020106
-
Strong negative self regulation of prokaryotic transcription factors increases the intrinsic noise of protein expression.BMC Syst Biol. 2008 Jan 18;2:6. doi: 10.1186/1752-0509-2-6. BMC Syst Biol. 2008. PMID: 18205926 Free PMC article.
-
Controlling cell-to-cell variability with synthetic gene circuits.Biochem Soc Trans. 2019 Dec 20;47(6):1795-1804. doi: 10.1042/BST20190295. Biochem Soc Trans. 2019. PMID: 31803907 Review.
-
Stochastic and delayed stochastic models of gene expression and regulation.Math Biosci. 2010 Jan;223(1):1-11. doi: 10.1016/j.mbs.2009.10.007. Epub 2009 Oct 31. Math Biosci. 2010. PMID: 19883665 Review.
Cited by
-
Stochastic modelling of biochemical systems of multi-step reactions using a simplified two-variable model.BMC Syst Biol. 2013;7 Suppl 4(Suppl 4):S14. doi: 10.1186/1752-0509-7-S4-S14. Epub 2013 Oct 23. BMC Syst Biol. 2013. PMID: 24565085 Free PMC article.
-
A higher-order numerical framework for stochastic simulation of chemical reaction systems.BMC Syst Biol. 2012 Jul 15;6:85. doi: 10.1186/1752-0509-6-85. BMC Syst Biol. 2012. PMID: 23256696 Free PMC article.
-
Type of noise defines global attractors in bistable molecular regulatory systems.J Theor Biol. 2013 Jan 21;317:140-51. doi: 10.1016/j.jtbi.2012.10.004. Epub 2012 Oct 11. J Theor Biol. 2013. PMID: 23063780 Free PMC article.
-
Order reduction of the chemical master equation via balanced realisation.PLoS One. 2014 Aug 14;9(8):e103521. doi: 10.1371/journal.pone.0103521. eCollection 2014. PLoS One. 2014. PMID: 25121581 Free PMC article.
-
Stochastic steady state gain in a gene expression process with mRNA degradation control.J R Soc Interface. 2012 Jul 7;9(72):1589-98. doi: 10.1098/rsif.2011.0757. Epub 2012 Jan 11. J R Soc Interface. 2012. PMID: 22237678 Free PMC article.
References
-
- McAdams H.H., Arkin A. It's a noisy business! Genetic regulation at the nanomolar scale. Trends Genet. 1999;15:65–69. - PubMed
-
- Elowitz M.B., Levine A.J., Swain P.S. Stochastic gene expression in a single cell. Science. 2002;297:1183–1186. - PubMed
-
- Paulsson J. Models of stochastic gene expression. Phys. Life Rev. 2005;2:157–175.
Publication types
MeSH terms
Substances
LinkOut - more resources
Full Text Sources
