

Task-oriented modular decomposition of biological networks: trigger mechanism in blood coagulation
- PMID: 20441738
- PMCID: PMC2862209
- DOI: 10.1016/j.bpj.2010.01.027
Task-oriented modular decomposition of biological networks: trigger mechanism in blood coagulation
Abstract
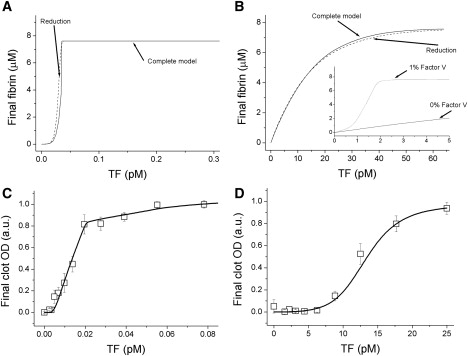
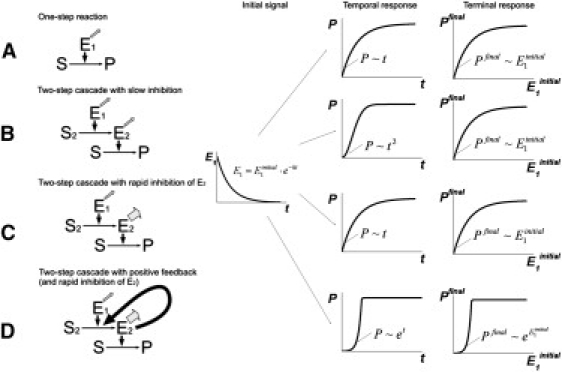
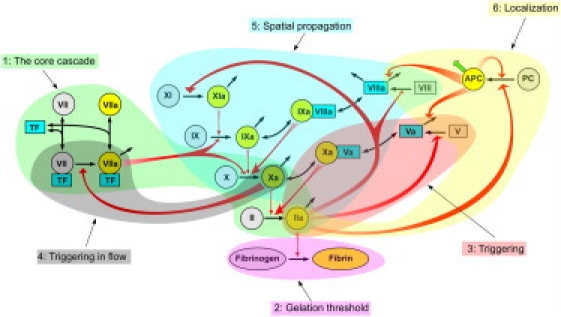
Analysis of complex time-dependent biological networks is an important challenge in the current postgenomic era. We propose a middle-out approach for decomposition and analysis of complex time-dependent biological networks based on: 1), creation of a detailed mechanism-driven mathematical model of the network; 2), network response decomposition into several physiologically relevant subtasks; and 3), subsequent decomposition of the model, with the help of task-oriented necessity and sensitivity analysis into several modules that each control a single specific subtask, which is followed by further simplification employing temporal hierarchy reduction. The technique is tested and illustrated by studying blood coagulation. Five subtasks (threshold, triggering, control by blood flow velocity, spatial propagation, and localization), together with responsible modules, can be identified for the coagulation network. We show that the task of coagulation triggering is completely regulated by a two-step pathway containing a single positive feedback of factor V activation by thrombin. These theoretical predictions are experimentally confirmed by studies of fibrin generation in normal, factor V-, and factor VIII-deficient plasmas. The function of the factor V-dependent feedback is to minimize temporal and parametrical intervals of fibrin clot instability. We speculate that this pathway serves to lessen possibility of fibrin clot disruption by flow and subsequent thromboembolism.
Copyright (c) 2010 Biophysical Society. Published by Elsevier Inc. All rights reserved.
Figures
Similar articles
-
Coagulation pathways: interrelationships and control mechanisms.Semin Hematol. 1977 Jul;14(3):301-18. Semin Hematol. 1977. PMID: 69320 Review. No abstract available.
-
Molecular mechanisms in blood coagulation.Curr Top Cell Regul. 1973;7:51-86. Curr Top Cell Regul. 1973. PMID: 4592483 Review. No abstract available.
-
Theories of blood coagulation. Properties and interactions of blood clotting factors.Ann Clin Lab Sci (1971). 1971 Sep-Oct;1(2):139-54. Ann Clin Lab Sci (1971). 1971. PMID: 4949446 Review. No abstract available.
-
Basic mechanisms in blood coagulation.Annu Rev Biochem. 1975;44:799-829. doi: 10.1146/annurev.bi.44.070175.004055. Annu Rev Biochem. 1975. PMID: 237463 Review. No abstract available.
-
Blood coagulation: a cybernetic system.Ser Haematol. 1973;6(4):549-78. Ser Haematol. 1973. PMID: 4277382 No abstract available.
Cited by
-
Thrombin activity propagates in space during blood coagulation as an excitation wave.Biophys J. 2012 Nov 21;103(10):2233-40. doi: 10.1016/j.bpj.2012.10.011. Epub 2012 Nov 20. Biophys J. 2012. PMID: 23200057 Free PMC article.
-
Circulating contact-pathway-activating microparticles together with factors IXa and XIa induce spontaneous clotting in plasma of hematology and cardiologic patients.PLoS One. 2014 Jan 31;9(1):e87692. doi: 10.1371/journal.pone.0087692. eCollection 2014. PLoS One. 2014. PMID: 24498168 Free PMC article. Clinical Trial.
-
Sensitivity and Robustness of Spatially Dependent Thrombin Generation and Fibrin Clot Propagation.Biophys J. 2018 Dec 18;115(12):2461-2473. doi: 10.1016/j.bpj.2018.11.009. Epub 2018 Nov 14. Biophys J. 2018. PMID: 30514632 Free PMC article.
-
Methylation potential associated with diet, genotype, protein, and metabolite levels in the Delta Obesity Vitamin Study.Genes Nutr. 2014 May;9(3):403. doi: 10.1007/s12263-014-0403-9. Epub 2014 Apr 24. Genes Nutr. 2014. PMID: 24760553 Free PMC article.
-
Positive feedback loops for factor V and factor VII activation supply sensitivity to local surface tissue factor density during blood coagulation.Biophys J. 2011 Oct 19;101(8):1816-24. doi: 10.1016/j.bpj.2011.08.034. Biophys J. 2011. PMID: 22004734 Free PMC article.
References
-
- Sachs K., Gifford D., Lauffenburger D.A. Bayesian network approach to cell signaling pathway modeling. Sci. STKE. 2002;2002:E38. - PubMed
-
- Westerhoff H.V. Signaling control strength. J. Theor. Biol. 2008;252:555–567. - PubMed
-
- Liu G., Swihart M.T., Neelamegham S. Sensitivity, principal component and flux analysis applied to signal transduction: the case of epidermal growth factor mediated signaling. Bioinformatics. 2005;21:1194–1202. - PubMed
-
- Kholodenko B.N., Schuster S., Cascante M. Control analysis of metabolic systems involving quasi-equilibrium reactions. Biochim. Biophys. Acta. 1998;1379:337–352. - PubMed
-
- Tikhonov A.N. Systems of differential equations containing small parameters in the derivatives. Matematicheskii Sbornik. 1952;31:575–586. [in Russian]
Publication types
MeSH terms
Substances
LinkOut - more resources
Full Text Sources
Molecular Biology Databases
