. 2010 May 19;98(9):1856-63.
doi: 10.1016/j.bpj.2009.12.4333.

Urea facilitates the translocation of single-stranded DNA and RNA through the alpha-hemolysin nanopore

Affiliations

Urea facilitates the translocation of single-stranded DNA and RNA through the alpha-hemolysin nanopore

Deanpen Japrung et al. Biophys J. .

Abstract

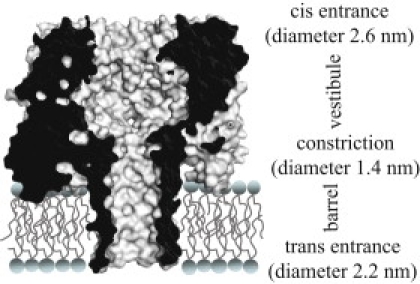
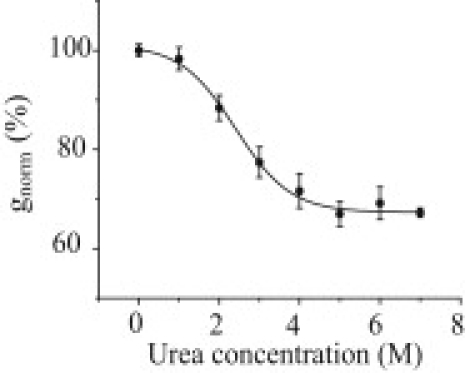
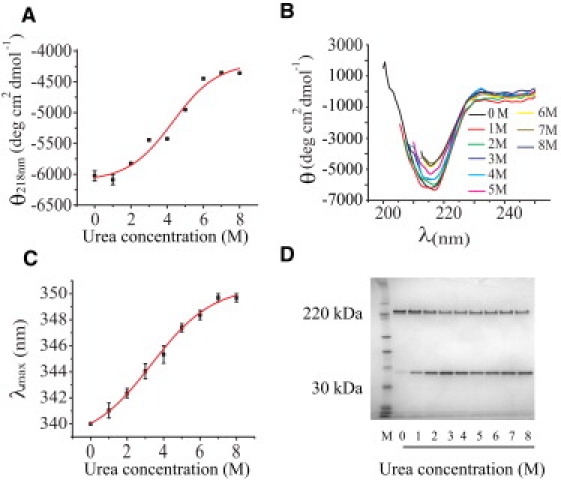
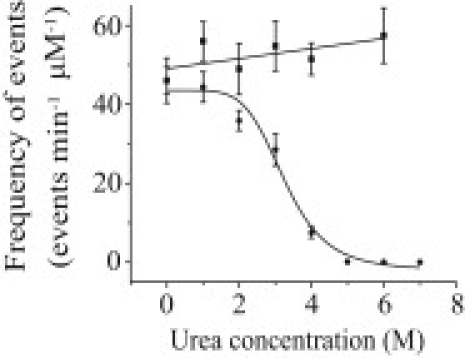
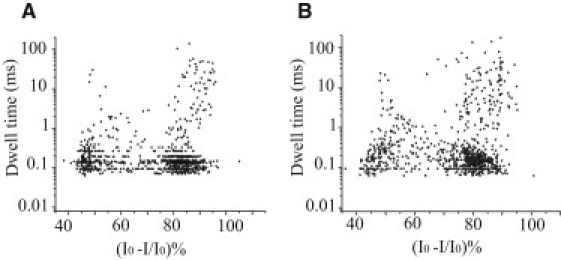
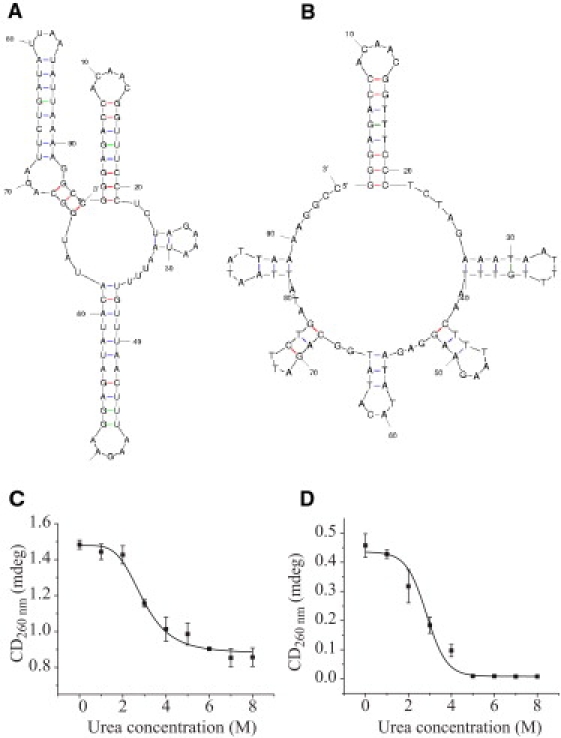
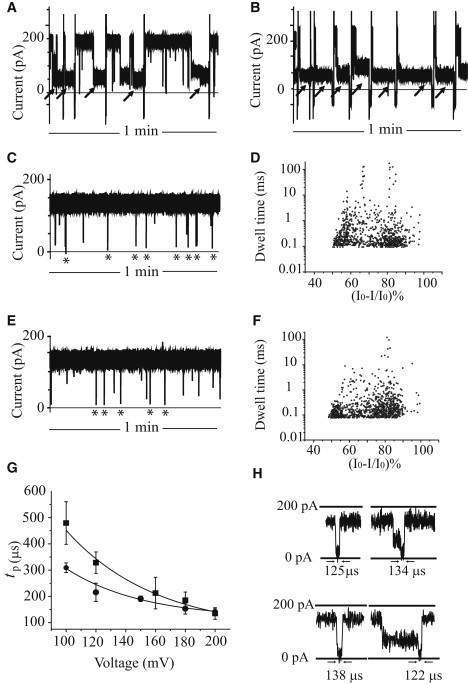
The staphylococcal alpha-hemolysin (alphaHL) protein nanopore is under investigation as a fast, cheap detector for nucleic acid analysis and sequencing. Although discrimination of all four bases of DNA by the alphaHL pore has been demonstrated, analysis of single-stranded DNAs and RNAs containing secondary structure mediated by basepairing is prevented because these nucleic acids cannot be translocated through the pore. Here, we show that a structured 95-nucleotide single-stranded DNA and its RNA equivalent are translocated through the alphaHL pore in the presence of 4 M urea, a concentration that denatures the secondary structure of the polynucleotides. The alphaHL pore is functional even in 7 M urea, and therefore it is easily stable enough for analyses of challenging DNA and RNA species.


Figures

Figure 1
Figure 1
Cross section of the WT-αHL heptamer (PDB: 7AHL). The constriction (diameter: 1.4 nm) divides the pore into the cap domain, which is located on the cis side of the lipid bilayer and contains the vestibule, and the β-barrel, which is located within the bilayer.
Figure 2
Figure 2
Effect of urea on gnorm (%), the normalized ionic current, passing through the αHL pore at +150 mV in 1 M KCl, 5 mM HEPES, pH 7.5. The black line indicates a sigmoidal fit with a midpoint at 2.4 ± 0.3 M urea.
Figure 3
Figure 3
Effect of urea on the structure of the heptameric αHL pore. The CD and fluorescence spectroscopy studies were conducted after the heptamer had been incubated for 6 h in 20 mM sodium phosphate, 150 mM NaCl, 0.3% (w/v) SDS, pH 8.0, containing 0–8 M urea. (A) Change in the CD signal of the heptamer measured at 218 nm versus the urea concentration. The midpoint of the sigmoidal fit is at 4.3 ± 0.2 M. (B) CD spectra of the αHL heptamer measured at 200–250 nm at various urea concentrations. (C) Dependence of the fluorescence emission maximum (λmaxem, excitation at 280 nm) of the αHL heptamer as a function of urea concentration. The midpoint of the sigmoidal fit is at 3.3 ± 0.1 M. (D) SDS-PAGE shows the extent of dissociation of the αHL heptamer to monomer after 10 h of incubation at various urea concentrations.
Figure 4
Figure 4
Effect of urea on the frequency of occurrence of DNA translocation through the αHL pore in 1 M KCl, 5 mM HEPES, pH 7.5. The circles indicate the frequency of DNA translocation at a constant voltage of +150 mV. The squares indicate the frequency of DNA translocation at a constant current of +153 pA (+210 mV at 6 M urea). The sigmoidal fit of the frequency of DNA translocation at a constant voltage has a midpoint at 3.2 ± 0.5 M urea. The linear line shows the trend of the frequency of DNA translocation at a constant current.
Figure 5
Figure 5
Effect of urea on the current blockades caused by the unstructured 100-nt ssDNA A30C70 with the αHL pore. (A) Scatter plot of the ionic current blockades, (I0I)/I0 (%), and dwell times for current blockades in the absence of urea, where I0 is the current through the open pore and I is the current during a DNA blockade. (B) Scatter plot of the ionic current blockades, (I0I)/I0 (%), and dwell times for current blockades in the presence of 4 M urea. Blockades < 75% represent vestibule events, and blockades > 75% represent translocation events.
Figure 6
Figure 6
Properties of the 95-nt ssRNA and ssDNA used in this study. (A) The secondary structure of the 95-nt RNA predicted by Mfold (ΔG = −31.8 kcal mol−1). (B) The secondary structure of the 95-nt ssDNA predicted by Mfold (ΔG = −12.4 kcal mol−1). (C) The CD signal (mdeg) at 260 nm of the 95-nt RNA in 1 M KCl, 5 mM HEPES, pH 7.50, as a function of the urea concentration. The sigmoidal fit has a midpoint at 2.9 ± 0.1 M urea. (D) The CD signal (mdeg) at 260 nm of the 95-nt ssDNA, under the same conditions as in C. The sigmoidal fit has a midpoint at 2.8 ± 0.2 M urea.
Figure 7
Figure 7
Effect of urea on the interactions of the 95-nt ssDNA and ssRNA with the αHL pore. (A) Current blockades induced by the 95-nt ssDNA in 1 M KCl, 5 mM HEPES, pH 7.5. (B) Current blockades induced by the 95-nt ssRNA in the same buffer. The very long blockades (black arrows) most likely do not correspond to DNA and RNA translocation events. The occluded pores were reopened by ramping the potential to a negative value and then back to a positive value. (C) Current blockades induced by the 95-nt ssDNA in the presence of 4 M urea. The short blockades (asterisks, 75–95% current block) represent the translocation of ssDNA. (D) Scatter plot of the ionic current blockades and dwell times for blockades induced by the 95-nt ssDNA in the presence of 4 M urea. (E) Current blockades induced by the 95-nt RNA in the presence of 4 M urea. The asterisks indicate the translocation events. (F) Scatter plot of the ionic current blockades and dwell times for blockades induced by the 95-nt RNA in the presence of 4 M urea. (G) Voltage dependence of the most probable translocation times, tp, for the 95-nt ssDNA (circles) and 95-nt ssRNA (squares) at +100 mV to +200 mV. The buffer was 1 M KCl, 5 mM HEPES, pH 7.5, containing 4 M urea. (H) Selected translocation events for the 95-nt ssDNA and RNA. (Top) 95-nt ssDNA in the presence of 4 M urea. The left-hand event is a simple low-amplitude event, which is a direct translocation of ssDNA through the pore. The right-hand event shows a mid-amplitude signal followed by a low-amplitude signal, which represents a sojourn of ssDNA in the vestibule, followed by translocation through the pore. (Bottom) 95-nt ssRNA in the presence of 4 M urea. The left-hand event shows direct translocation of ssRNA through the pore, and the right-hand event represents a sojourn in the vestibule followed by translocation.

Similar articles

Cited by

References

    1. Kasianowicz J.J., Brandin E., Deamer D.W. Characterization of individual polynucleotide molecules using a membrane channel. Proc. Natl. Acad. Sci. USA. 1996;93:13770–13773. - PMC - PubMed
    1. Song L., Hobaugh M.R., Gouaux J.E. Structure of staphylococcal α-hemolysin, a heptameric transmembrane pore. Science. 1996;274:1859–1866. - PubMed
    1. Henrickson S.E., Misakian M., Kasianowicz J.J. Driven DNA transport into an asymmetric nanometer-scale pore. Phys. Rev. Lett. 2000;85:3057–3060. - PubMed
    1. Meller A., Nivon L., Branton D. Rapid nanopore discrimination between single polynucleotide molecules. Proc. Natl. Acad. Sci. USA. 2000;97:1079–1084. - PMC - PubMed
    1. Kasianowicz J.J., Henrickson S.E., Robertson B. Simultaneous multianalyte detection with a nanometer-scale pore. Anal. Chem. 2001;73:2268–2272. - PubMed

Publication types

MeSH terms

LinkOut - more resources