

Calculating partition coefficients of chain anchors in liquid-ordered and liquid-disordered phases
- PMID: 20441752
- PMCID: PMC2862203
- DOI: 10.1016/j.bpj.2010.01.036
Calculating partition coefficients of chain anchors in liquid-ordered and liquid-disordered phases
Abstract
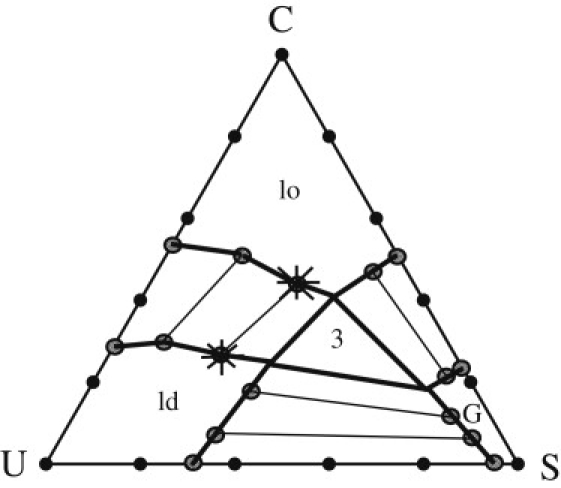
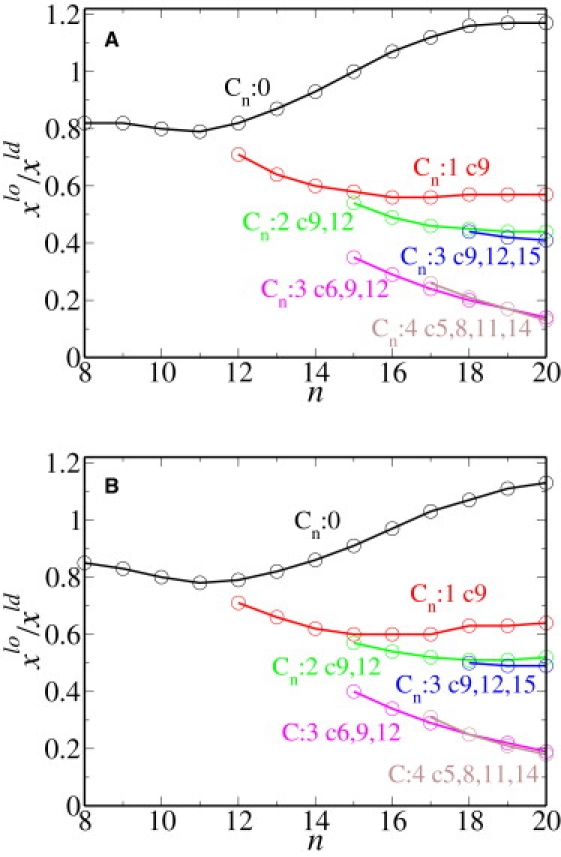
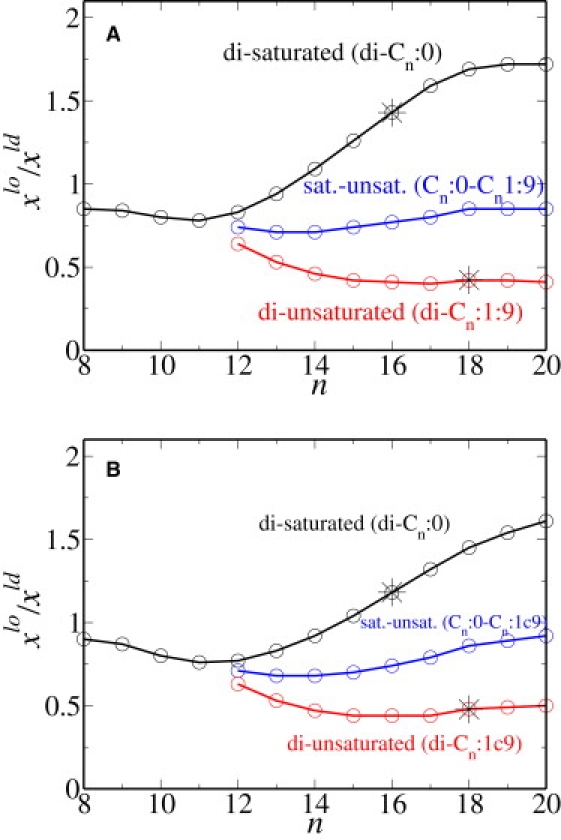
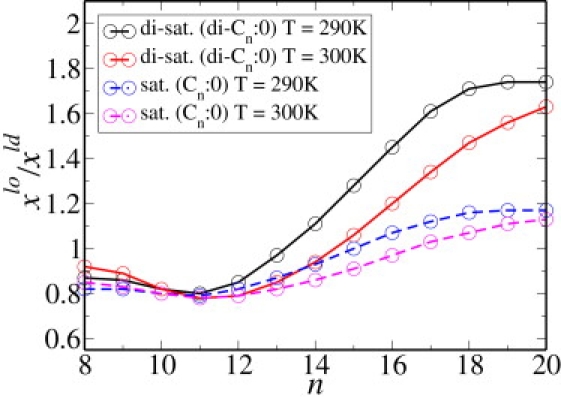
We calculate partition coefficients of various chain anchors in liquid-ordered and liquid-disordered phases utilizing a theoretical model of a bilayer membrane containing cholesterol, dipalmitoyl phosphatidylcholine, and dioleoylphosphatidylcholine. The partition coefficients are calculated as a function of chain length, degree of saturation, and temperature. Partitioning depends on the difference between the lipid environments of the coexisting phases in which the anchors are embedded. Consequently, the partition coefficient depends on the nature of the anchor, and on the relative compositions of the coexisting phases. We find that saturated anchors prefer the denser liquid-ordered phase, and that the fraction of anchors in the liquid-ordered phase increases with increasing degree of saturation of the anchors. The partition coefficient also depends upon the location of the double bonds. Anchors with double bonds closer to the middle of the chain have a greater effect on partitioning than those near the end. Doubling the number of saturated chains increases the partitioning into the liquid-ordered phase for tails that are nearly as long or longer than those comprising the bilayer. Partitioning of such chains increases with decreasing temperature, indicating that energy considerations dominate entropic ones. In contrast, partitioning of shorter chains increases with increasing temperature, indicating that entropic considerations dominate.
Copyright (c) 2010 Biophysical Society. Published by Elsevier Inc. All rights reserved.
Figures
Similar articles
-
The partition of cholesterol between ordered and fluid bilayers of phosphatidylcholine: a synchrotron X-ray diffraction study.Biochim Biophys Acta. 2007 Nov;1768(11):2873-81. doi: 10.1016/j.bbamem.2007.07.023. Epub 2007 Aug 16. Biochim Biophys Acta. 2007. PMID: 17900525
-
Mode specific elastic constants for the gel, liquid-ordered, and liquid-disordered phases of DPPC/DOPC/cholesterol model lipid bilayers.Faraday Discuss. 2013;161:177-91; discussion 273-303. doi: 10.1039/c2fd20091k. Faraday Discuss. 2013. PMID: 23805743 Free PMC article.
-
Partitioning of amphiphiles between coexisting ordered and disordered phases in two-phase lipid bilayer membranes.Biophys J. 2000 Jun;78(6):3019-25. doi: 10.1016/S0006-3495(00)76840-8. Biophys J. 2000. PMID: 10827980 Free PMC article.
-
Partitioning of lipidated peptide sequences into liquid-ordered lipid domains in model and biological membranes.Biochemistry. 2001 Oct 30;40(43):13031-40. doi: 10.1021/bi0112311. Biochemistry. 2001. PMID: 11669641
-
An Unexpected Driving Force for Lipid Order Appears in Asymmetric Lipid Bilayers.J Am Chem Soc. 2023 Oct 11;145(40):21717-21722. doi: 10.1021/jacs.3c05081. Epub 2023 Sep 8. J Am Chem Soc. 2023. PMID: 37683131 Review.
Cited by
-
Interleaflet coupling and domain registry in phase-separated lipid bilayers.Biophys J. 2011 Feb 16;100(4):996-1004. doi: 10.1016/j.bpj.2011.01.021. Biophys J. 2011. PMID: 21320444 Free PMC article.
-
Membrane curvature enables N-Ras lipid anchor sorting to liquid-ordered membrane phases.Nat Chem Biol. 2015 Mar;11(3):192-4. doi: 10.1038/nchembio.1733. Epub 2015 Jan 26. Nat Chem Biol. 2015. PMID: 25622090
-
n-Alcohol Length Governs Shift in Lo-Ld Mixing Temperatures in Synthetic and Cell-Derived Membranes.Biophys J. 2017 Sep 19;113(6):1200-1211. doi: 10.1016/j.bpj.2017.06.066. Epub 2017 Aug 9. Biophys J. 2017. PMID: 28801104 Free PMC article.
-
Modulation of a small two-domain lipid vesicle by linactants.J Phys Chem B. 2014 Jul 31;118(30):9028-36. doi: 10.1021/jp5042525. Epub 2014 Jul 16. J Phys Chem B. 2014. PMID: 25003709 Free PMC article.
-
Model Plasma Membrane Exhibits a Microemulsion in Both Leaves Providing a Foundation for "Rafts".Biophys J. 2020 Mar 10;118(5):1019-1031. doi: 10.1016/j.bpj.2020.01.004. Epub 2020 Jan 16. Biophys J. 2020. PMID: 32023433 Free PMC article.
References
-
- Simons K., Toomre D. Lipid rafts and signal transduction. Nat. Rev. Mol. Cell Biol. 2000;1:31–39. - PubMed
-
- Edidin M. The state of lipid rafts: from model membranes to cells. Annu. Rev. Biophys. Biomol. Struct. 2003;32:257–283. - PubMed
-
- Munro S. Lipid rafts: elusive or illusive? Cell. 2003;115:377–388. - PubMed
-
- Simons K., Vaz W.L. Model systems, lipid rafts, and cell membranes. Annu. Rev. Biophys. Biomol. Struct. 2004;33:269–295. - PubMed
-
- McMullen T., Lewis R.N., McElhaney R. Cholesterol-phospholipid interactions, the liquid-ordered phase and lipid rafts in model and biological membranes. Curr. Opin. Coll. Int. Sci. 2004;8:459–468.
Publication types
MeSH terms
Substances
Grants and funding
LinkOut - more resources
Full Text Sources
