Whole brain quantitative T2 MRI across multiple scanners with dual echo FSE: applications to AD, MCI, and normal aging
- PMID: 20441797
- PMCID: PMC2907072
- DOI: 10.1016/j.neuroimage.2010.04.255
Whole brain quantitative T2 MRI across multiple scanners with dual echo FSE: applications to AD, MCI, and normal aging
Abstract
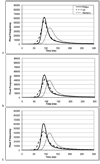
The ability to pool data from multiple MRI scanners is becoming increasingly important with the influx in multi-site research studies. Fast spin echo (FSE) dual spin echo sequences are often chosen for such studies based principally on their short acquisition time and the clinically useful contrasts they provide for assessing gross pathology. The practicality of measuring FSE-T2 relaxation properties has rarely been assessed. Here, FSE-T2 relaxation properties are examined across the three main scanner vendors (General Electric (GE), Philips, and Siemens). The American College of Radiology (ACR) phantom was scanned on four 1.5T platforms (two GE, one Philips, and one Siemens) to determine if the dual echo pulse sequence is susceptible to vendor-based variance. In addition, data from 85 subjects spanning the spectrum of normal aging, mild cognitive impairment (MCI), and Alzheimer's disease (AD) was obtained from the Alzheimer's Disease Neuroimaging Initiative (ADNI) to affirm the presence of any phantom based between vendor variance and determine the relationship between this variance and disease. FSE-T2 relaxation properties, including peak FSE-T2 and histogram width, were calculated for each phantom and human subject. Direct correspondence was found between the phantom and human subject data. Peak FSE-T2 of Siemens scanners was consistently at least 20ms prolonged compared to GE and Philips. Siemens scanners showed broader FSE-T2 histograms than the other scanners. Greater variance was observed across GE scanners than either Philips or Siemens. FSE-T2 differences were much greater with scanner vendor than between diagnostic groups, as no significant changes in peak FSE-T2 or histogram width between normal aged, MCI, and AD subject groups were observed. These results indicate that whole brain histogram measures are not sensitive enough to detect FSE-T2 changes between normal aging, MCI, and AD and that FSE-T2 is highly variable across scanner vendors.
Copyright (c) 2010 Elsevier Inc. All rights reserved.
Figures


Similar articles
-
Phantom Safety Assessment of 3 Tesla Magnetic Resonance Imaging in Directional and Sensing Deep Brain Stimulation Devices.Stereotact Funct Neurosurg. 2025;103(1):42-54. doi: 10.1159/000542725. Epub 2024 Nov 27. Stereotact Funct Neurosurg. 2025. PMID: 39602889 Free PMC article.
-
Estimating and accounting for the effect of MRI scanner changes on longitudinal whole-brain volume change measurements.Neuroimage. 2019 Jan 1;184:555-565. doi: 10.1016/j.neuroimage.2018.09.062. Epub 2018 Sep 22. Neuroimage. 2019. PMID: 30253207
-
Improvements in Between-Vendor MRI Harmonization of Renal T2 Mapping using Stimulated Echo Compensation.J Magn Reson Imaging. 2024 Nov;60(5):2144-2155. doi: 10.1002/jmri.29282. Epub 2024 Feb 21. J Magn Reson Imaging. 2024. PMID: 38380700
-
T2 relaxometry measurements in low spatial frequency brain regions differ between fast spin-echo and multiple-echo spin-echo sequences.MAGMA. 2013 Oct;26(5):443-50. doi: 10.1007/s10334-012-0364-1. Epub 2013 Jan 26. MAGMA. 2013. PMID: 23354513
-
Update on the magnetic resonance imaging core of the Alzheimer's disease neuroimaging initiative.Alzheimers Dement. 2010 May;6(3):212-20. doi: 10.1016/j.jalz.2010.03.004. Alzheimers Dement. 2010. PMID: 20451869 Free PMC article. Review.
Cited by
-
Simultaneous high-resolution T2 -weighted imaging and quantitative T2 mapping at low magnetic field strengths using a multiple TE and multi-orientation acquisition approach.Magn Reson Med. 2022 Sep;88(3):1273-1281. doi: 10.1002/mrm.29273. Epub 2022 May 12. Magn Reson Med. 2022. PMID: 35553454 Free PMC article.
-
Quantitative multi-parameter mapping of R1, PD(*), MT, and R2(*) at 3T: a multi-center validation.Front Neurosci. 2013 Jun 10;7:95. doi: 10.3389/fnins.2013.00095. eCollection 2013. Front Neurosci. 2013. PMID: 23772204 Free PMC article.
-
The Alzheimer's Disease Neuroimaging Initiative: a review of papers published since its inception.Alzheimers Dement. 2013 Sep;9(5):e111-94. doi: 10.1016/j.jalz.2013.05.1769. Epub 2013 Aug 7. Alzheimers Dement. 2013. PMID: 23932184 Free PMC article. Review.
-
Colorization and automated segmentation of human T2 MR brain images for characterization of soft tissues.PLoS One. 2012;7(3):e33616. doi: 10.1371/journal.pone.0033616. Epub 2012 Mar 27. PLoS One. 2012. PMID: 22479421 Free PMC article.
-
Association Between Brain Gene Expression, DNA Methylation, and Alteration of Ex Vivo Magnetic Resonance Imaging Transverse Relaxation in Late-Life Cognitive Decline.JAMA Neurol. 2017 Dec 1;74(12):1473-1480. doi: 10.1001/jamaneurol.2017.2807. JAMA Neurol. 2017. PMID: 29084334 Free PMC article.
References
-
- Arfanakis K, Gui M, Tamhane AA, Carew JD. Investigating the medial temporal lobe in Alzheimer’s Disease and mild cognitive impairment, with Turboprop diffusion tensor imaging, MRI-volumetry, and T2-relaxometry. Brain Imaging Behav. 2007;1:11–21.
-
- Auer S, Reisberg B. The GDS/FAST staging system. Int. Psychogeriat. 1997;1(9 Suppl):167–171. - PubMed
-
- Bartzokis G, Beckson M, Hance DB, Marx P, Foster JA, Marder SR. MR evaluation of age-related increase of brain iron in young adult and older normal males. Magn. Reson. Imaging. 1997;15:29–35. - PubMed
-
- DeCarli C, Massaro J, Harvey D, Hald J, Tullberg M, Au R, Beiser A, D’Agostino R, Wolf PA. Measures of brain morphology and infarction in the Framingham heart study: Establishing what is normal. Neurobiol. Aging. 2005;26:491–510. - PubMed
Publication types
MeSH terms
Grants and funding
LinkOut - more resources
Full Text Sources
Medical

